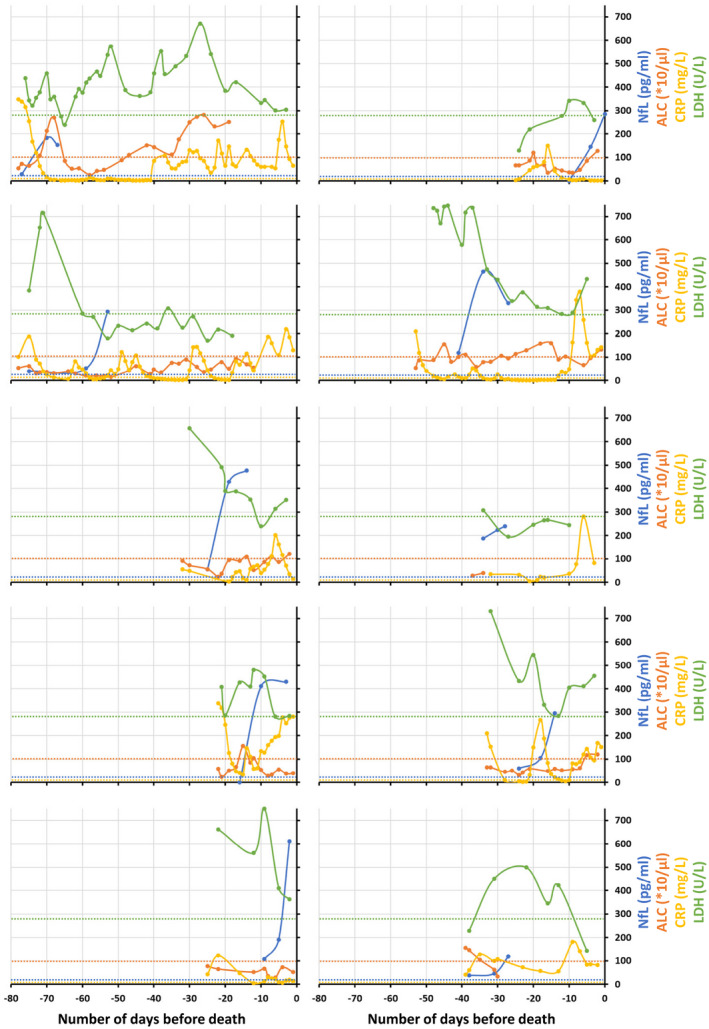
Figure 4.

In cohort 2, longitudinal plasma NfL (blue), ALC (orange), CRP (yellow), and LDH (green) levels in critically ill COVID‐19 patients those who died, plotted with respect to the number of days before death. Each plot represents individual patient data. The respective color dotted lines represent upper (for NfL, CRP, and LDH) or lower (for ALC) limit for HC for the respective biomarker (NfL: 20 pg/mL, ALC: 100 × 10/μL, CRP: 5 mg/L and LDH: 280 U/L). NfL, neurofilament light chain; ALC, absolute lymphocyte count; CRP, C‐reactive protein; LDH, lactate dehydrogenase; COVID‐19, coronavirus disease 19; HC, healthy controls. [Colour figure can be viewed at wileyonlinelibrary.com]
