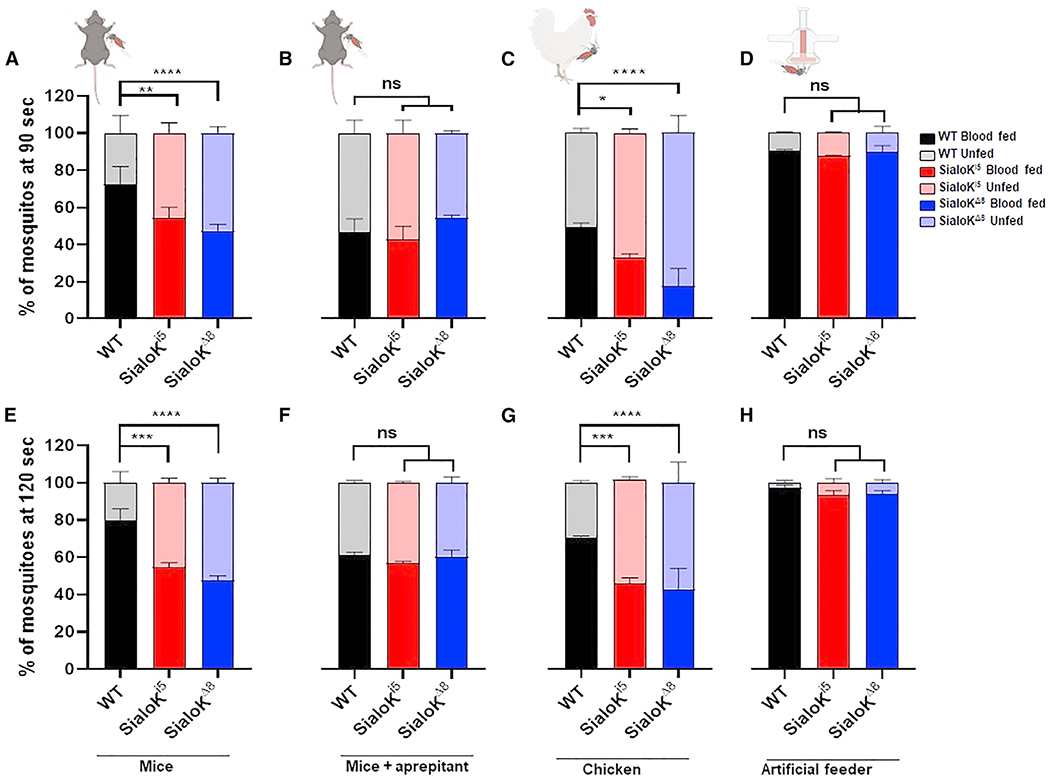
Figure 4. Feeding success analysis in sialokinin-KO Ae. aegypti.

Blood-feeding success rate: percentage of blood-fed females after 90 (A–C) or 120 s (D–F) in WT (black) and KO mosquitoes (sialoKi5, red, and sialoKΔ8, blue). Feeding success rates were determined in mice without (A and E) or with injections of aprepitant (B and F), chicken (C and G), and artificial membrane feeders (D and H). Feeding status data are presented as mean values of 2 independent experiments carried out by different operators. Each independent experiment consisted of 2 biological replicates of 100 mosquitoes each. Bars indicate SEMs. Contingency analyses were performed by chi-square and Fisher tests. For multiple comparisons, WT was selected as the control group. The p value indicates the result of the chi-square test: ns: p > 0.05; *p < 0.05; **p < 0.01; ***p < 0.001; ****p < 0.0001.
See also Figure S3.
