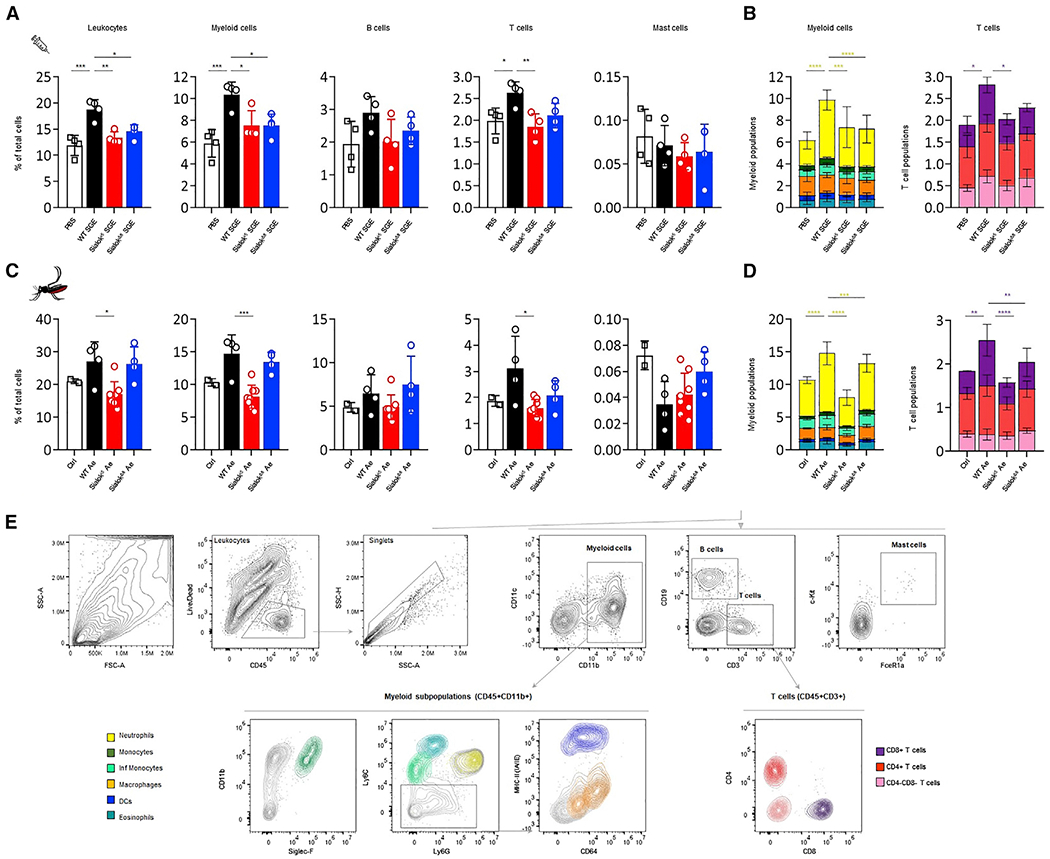
Figure 6. Host leukocyte recruitment to the SGE injection site or mosquito bite site using sialokinin-KO Ae. aegypti.

Flow cytometry analysis of leukocytes present in the footpad of mice 24 h after SGE injection (A and B) or mosquito bites (C and D).
(A) Graphs showing the percentage of leukocyte populations per mouse footpad 24 h after the injection of 6 μg SGE from WT or sialokinin-KO mosquitoes (same volume of PBS was injected in control animals: 40 μL) or (C) mosquito bites. Non-bitten footpads were used as controls.
(B and D) Combined graphs showing the distribution of myeloid or T cell subpopulations as a percentage of cells per footpad. Four mice per group were used.
(E) Flow cytometry gating strategy and color coding. Subpopulations were selected from leukocyte (CD45+Live/Dead−) singlets as follows: myeloid cells (CD11b+); eosinophils (CD11b+SiglecF+, blue-green); monocytes (CD11b+Ly6C+, light green); inflammatory monocytes (CD11b+Ly6Chi, dark green); neutrophils (CD11b+Ly6G+, yellow); macrophages (CD11b+Ly6C/G−CD64+, orange); dendritic cells (DCs, CD11b+Ly6C/G−MHC-IIhi CD11c+, dark blue); B cells (CD19+); mast cells (CD45+CD11b−CD3−CD19−cKit+FceR1a+); and CD4+ (dark red), CD8+ (purple), or CD4−CD8− (pink) T cells (CD3+). Four to eight samples were included in each experimental group. Each sample corresponds to 1 footpad. The results are indicated as the means ± SDs. One- (A and C) and 2-way (B and D) ANOVA tests were used to determine statistical significance. For multiple comparisons, the injection of WT SGE or bites of WT mosquitoes (WT Ae) were used as control groups. p values are indicated: ns: p > 0.05; *p < 0.05; **p < 0.01; ***p < 0.001; ****p < 0.0001.
See also Figure S4.
