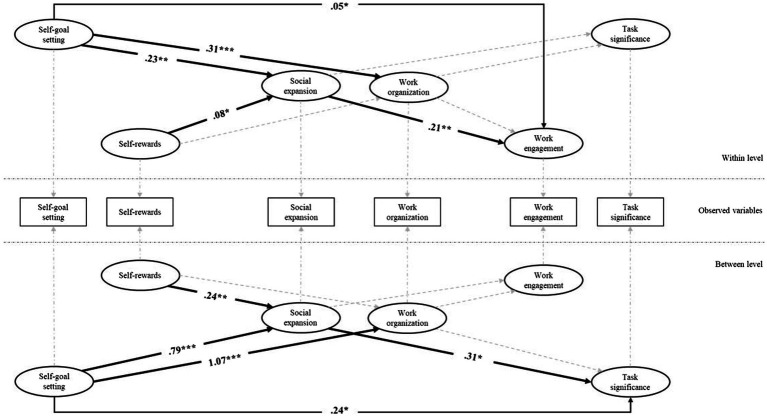
Figure 2.
Result of the multilevel model. Bold arrows represent significant paths. Non-standardized significant estimates are displayed. The results account for the role of number weekly remote working hours. Control variables (age and gender), related paths, and estimated paths from independent variables to outcome variables are not displayed for the sake of clarity. Only indirect paths that are significant are displayed. ***p ≤ 0.001, **p ≤ 0.01, and *p ≤ 0.05.

