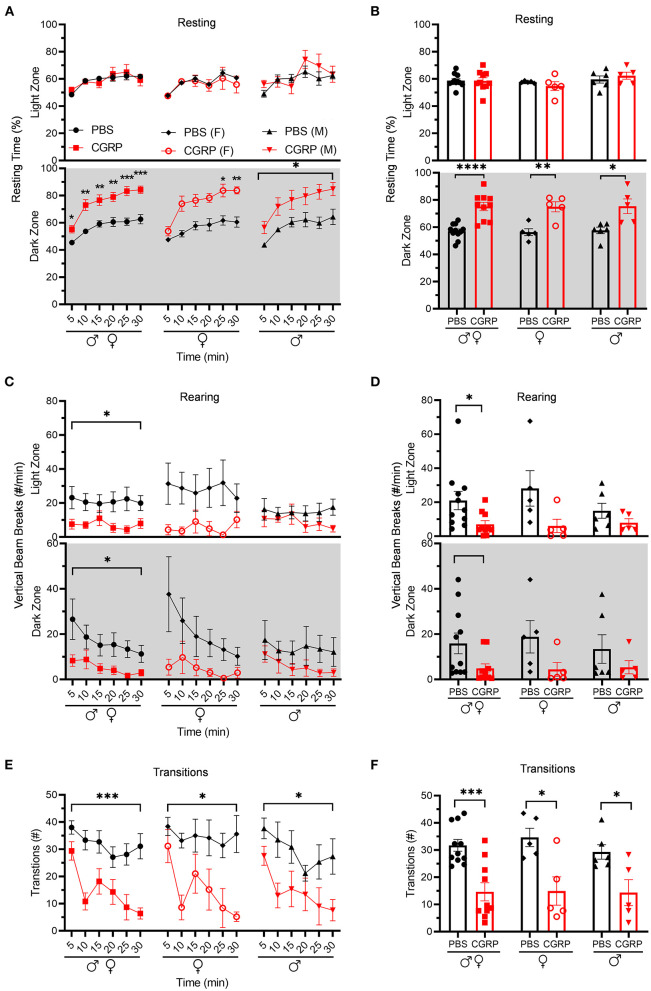
Figure 2.
Injection of CGRP into the MN reduced motility. Motility data were collected at the same time as light aversion data from the same mice shown in Figure 1. Mice were given PBS (n = 11; F: n = 5; M: n = 6) or CGRP (1 μg/200 nl; n = 10; F: n = 5; M: n = 5) into the right MN of C57BL/6J mice via cannulas. Data are from two independent experiments. (A) Percentage of time spent resting in the light (upper panel) and dark (lower panel) zones every 5-min block during 30-min light/dark assay for all mice (left), female mice (middle), and male mice (right). All mice in A are further analyzed in B. (B) Mean percentage of time in light (upper panel) and dark (lower panel) zones per 5-min block for individual mice from A. (C) Number of vertical beam breaks per min in light (upper panel) and dark (lower panel) zones every 5-min block during 30-min light/dark assay for all mice (left), female mice (middle), and male mice (right). All mice in C are further analyzed in D. (D) Mean number of vertical beam breaks in light (upper panel) and dark (lower panel) zones per 5-min block for individual mice from C. (E) Number of transitions between light and dark zones every 5-min block during 30-min light/dark assay for all mice (left), female mice (middle), and male mice (right). All mice in E are further analyzed in F. (F) Mean number of transitions between light and dark zones per 5-min block for individual mice from E. Data are the mean ± SEM. Statistics are described in Supplementary Table 1. *p ≤ 0.05, **p ≤ 0.01, ***p ≤ 0.001, ****p ≤ 0.0001.

