Figure 7.
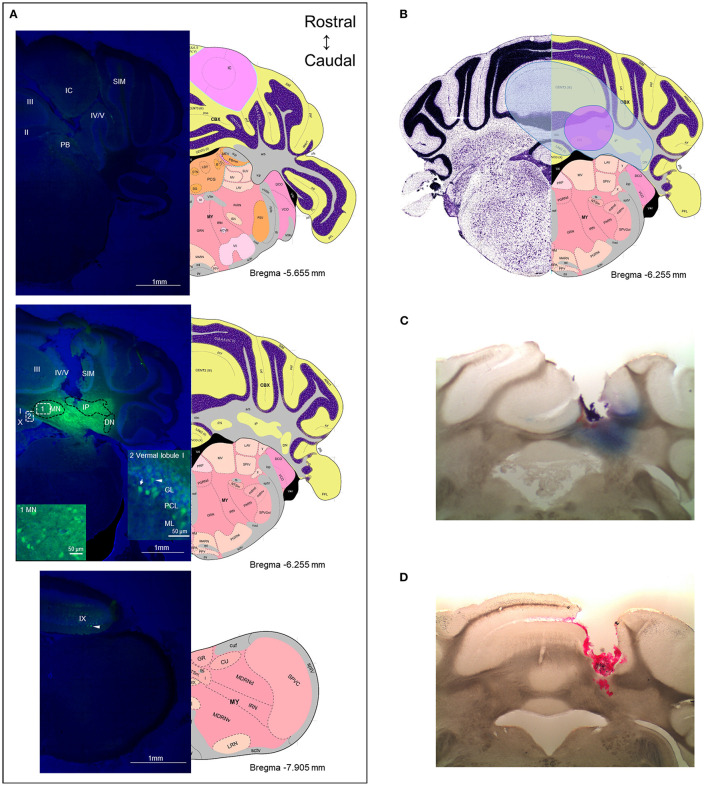
The diffusion range of CGRP. (A) Representative example of a mouse after injection of fluorescein-15-CGRP. Upper panel: In the most rostral section, dim fluorescence was detected in the inferior colliculus, the parabrachial nucleus, vermal lobules II-V, and the simple lobule. Middle panel: Fluorescein-15-CGRP at the injection site. Areas within rectangle are magnified in boxes 1 and 2. Clusters of fluorescein-15-CGRP were detected in cell bodies in the MN (box 1) and nearby cells, including the interposed and lateral cerebellar nuclei, granular, Purkinje cell, and molecular layers of vermal lobules I/III/IV/V (box 2). Dim signal was found in the simple lobule of the hemispheric regions. Lower panel: In the most caudal section, dim fluorescence was detected in lobule IX. Green: fluorescein-15-CGRP; Blue: TO-PRO-3. (B) The spread of the green fluorescence among the mice injected with fluorescein-15-CGRP. The smallest (purple shading) spread of signals covers the MN and few of nearby cells in the vermal lobules III/IV/V. The largest spread (blue shading) covers the MN and cells beyond the MN including vermal lobules I/III/IV/V/X, the simple lobule and other cerebellar deep nuclei. In summary, florescent signals were found in vermal lobules I-X, the simple lobule in the hemispheric region, and the midbrain (mainly in superior and inferior colliculus) from rostrally to caudally. (C) A representative image of a mouse with injection of Evans blue. (D) A representative image of a mouse with injection of red beads. DN, lateral cerebellar nucleus (dentate nucleus); GL, granular layer; IC, inferior colliculus; IP, interposed nucleus; ML, molecular layer; MN, medial cerebellar nucleus; PB, parabrachial nucleus; PCL, Purkinje cell layer; SIM, simple lobule. Image credit: Allen Institute. Numbers indicate the distance from bregma in the anteroposterior plane in Allen Mouse Brain Atlas coronal images.

