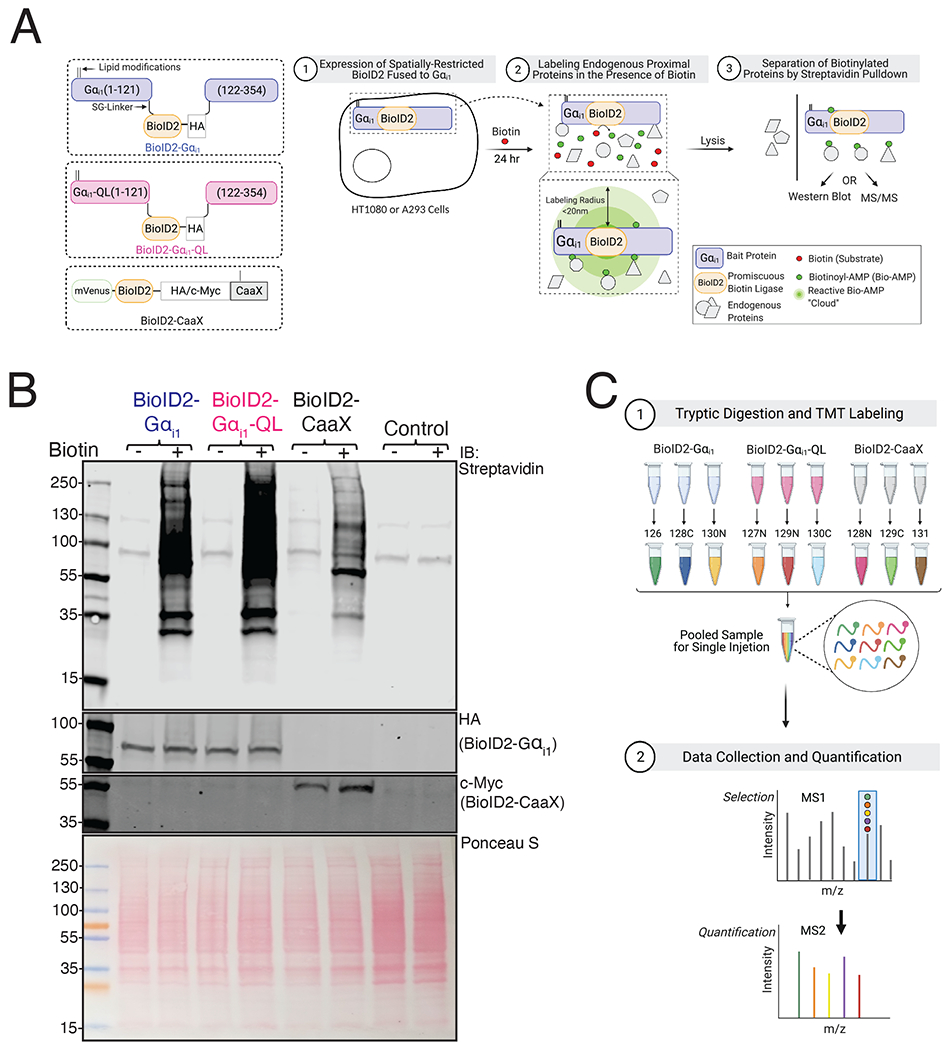
Figure 1. Principle and Experimental Workflow of Proximity Labeling of the Gαi1 Interactome.

(A) Left: Schematic of BioID2 fusion constructs. BioID2 was inserted between residues Ala121-Glu122 in the αb-αc loop (the first loop of the helical domain) of human Gαi1, flanked by SG-linkers. Palmitoylation and myristylation sites on the Gαi1 subunit and the farnesylation sites on CaaX moiety are labeled as lipid modifications. Right: Schematic of principle and experimental workflow of proximity-based labeling using BioID2. HT1080 cells were used for mass spectrometry experiments and A293 cells were used for pull-down western blot. Cells were transfected with the indicated constructs and labeled for 24 hr in the presence of biotin. Gαi1 fused BioID2 biotinylates proteins in proximity (< 20 nm) in an unbiased manner to identify candidate interacting proteins of Gαi1. (B) A293 cells were transfected with indicated constructs and labeled with biotin for 24 hr. Top: Biotinylated proteins in whole-cell lysates were detected on a streptavidin Western blot. The two bands at 130 and ~90 kDa correspond to endogenously biotinylated proteins in control lanes. Middle: Cell lysates were immunoblotted with Gαi1/2 antisera to detect BioID2-Gαi1 and BioID2-Gαi1-QL and with Myc antibody to detect BioID2-CaaX. Bottom: Ponceau S-stained blot showing total protein loading. Western blots are representative of three independent experiments that yielded similar results. (C) Schematic of sample processing and mass spectrometry analysis. Samples pulled down using streptavidin beads were digested with trypsin and labelled with a TMT tag. Biological triplicate samples of lysates of cells expressing BioID2-Gαi1, BioID2-Gαi1-QL and BioID2-CaaX were pooled and resolved by LC-MS and the data was analyzed using proteome discover.
