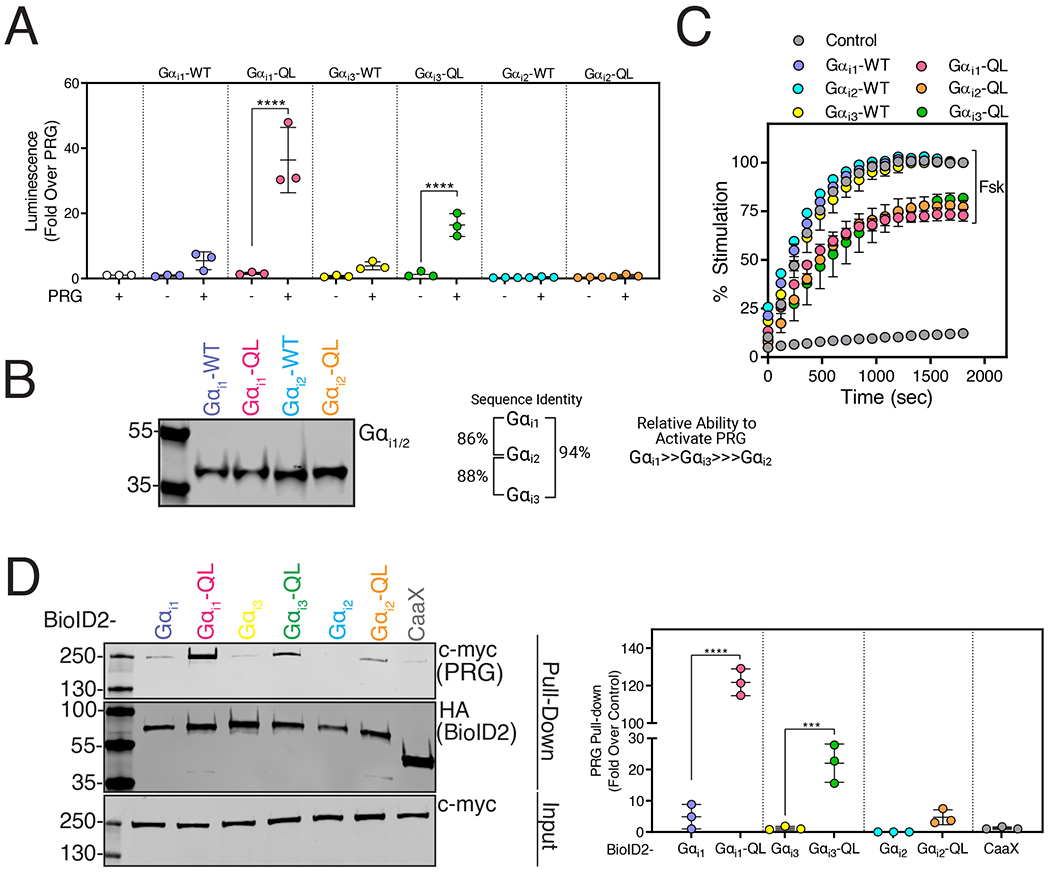
Figure 5. PRG Activation is Gαi Isoform Specific.

(A) A293 cells were transfected with cDNAs encoding SRE-Luciferase, PRG, and either Gαi1-QL, Gαi2-QL, or Gαi3-QL. Luminescence was measured in serum-starved cells 10 min after the addition of One-Glo™ reagent. The data represent the mean ± SD of three independent experiments. (B) Western blot showing relative expression of Gαi1 and Gαi2 constructs in A293 cells. Data are representative of three independent experiments that yielded similar results. (C) Cells were transfected with cAMP Glosensor™ and WT and QL versions of Gαi1, Gαi2, or Gαi3 for 24 hr. Luminescence was measured for 30 min (x-axis) after Forskolin (Fsk) stimulation and represented as % stimulation (y-axis) relative to the maximum signal in the respective WT group with 1 μM Fsk treatment. Data shown as mean ±SD are representative of three independent experiments (See fig. S5A for replicate experiments). (D) A293 cells were transfected with PRG and BioID2-Gαi1-QL, BioID2-Gαi3-QL, or BioID2-Gαi2-QL and labeled with biotin for 24 hr. Cell lysates were subjected to streptavidin pulldowns. Left: Representative Western blots of PRG in streptavidin pull-downs as well as of expression of BioID2-Gαi1, Gαi1-QL and BioID2-CaaX. Right: Quantitation shown as mean ± SD of three independent experiments normalized to total PRG. (***P <0.001, ****<0.0001, one-way ANOVA with Tukey’s multiple comparisons test).
