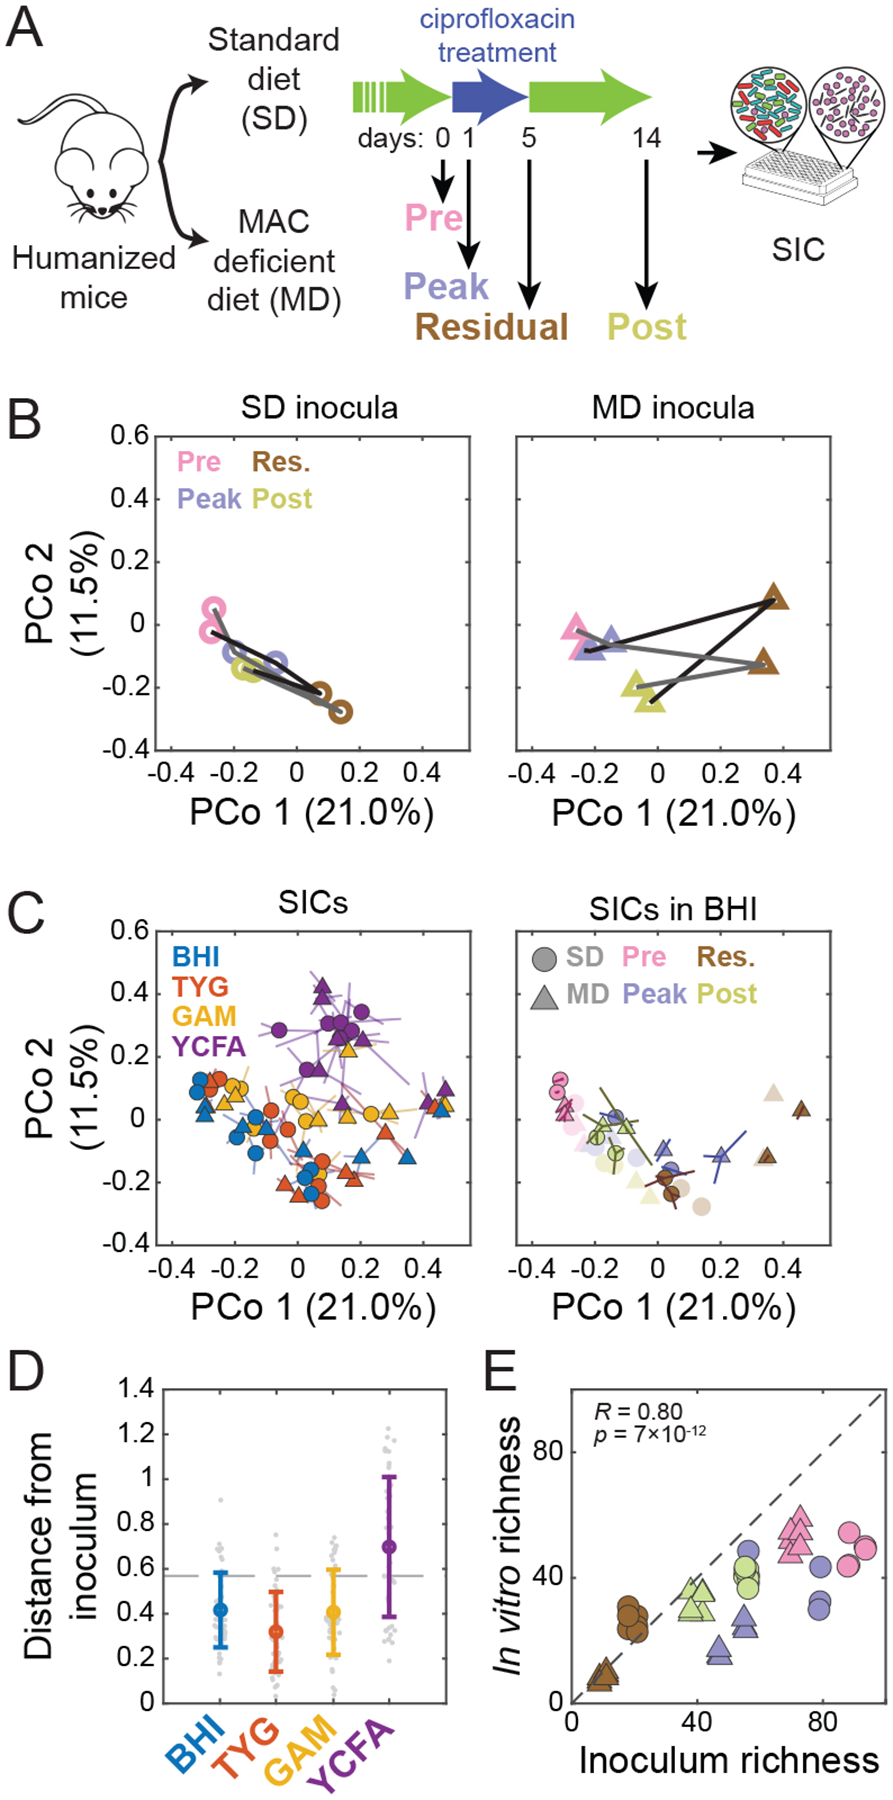
Figure 3: High-throughput cultivation of humanized-mouse feces preserves inoculum composition and richness.

A) Experimental setup. Germ-free mice colonized with feces from a single human donor (“humanized”) were fed an SD or an MD and treated with ciprofloxacin for 5 days. Fecal samples from two mice on each diet were collected on four days (0, 1, 5, 14) before, during, at the end of, and after treatment, and were inoculated into anaerobic batch culture and passaged with dilution every 48 h to derive SICs. Sixteen samples (2 diets, 2 mice, 4 time points during ciprofloxacin treatment) were inoculated into 4 media (BHI, TYG, GAM, and YCFA) in triplicate.
B) Diet alters the trajectory of microbiota reorganization during ciprofloxacin treatment in vivo. PCoA of community composition of the fecal inocula using unweighted Unifrac distance computed on all in vivo and in vitro samples at the ASV level. Lines (black and grey) correspond to two different mice.
C) Medium and inoculum determine the final composition of passaged SICs. The 7th passage of all 192 SICs is shown in a PCoA of SIC composition using unweighted Unifrac distance computed on all in vivo and in vitro samples at the ASV level. Left: samples are colored by media, with shapes representing the diet in the mice from which the inocula were taken. Symbols are the centroid of three replicates, with lines connecting the replicates to the centroid. Right: SICs derived in BHI with colors and shapes representing the timepoint during ciprofloxacin treatment and diet, respectively, in the mice from which the inocula were taken. Symbols are the centroid of three replicates, with lines connecting the replicates to the centroid. Original fecal inocula are plotted in light colors.
D) Most steady-state SICs are similar to the fecal samples from which they were derived, as shown by weighted Unifrac distance of the 7th passage of each SIC to the corresponding fecal inoculum. Colored circles, mean distance for each medium; individual SICs in gray. Error bars, standard deviations; n=48. Dashed line, mean distance between fecal samples.
E) SIC diversity correlates with inoculum diversity in BHI. Richness (number of ASVs in rarefied data) was compared for the 7th passage of each SIC and the corresponding fecal inocula, and separated and colored/shaped as in (C). R and p are for Pearson coefficient; n=48.
