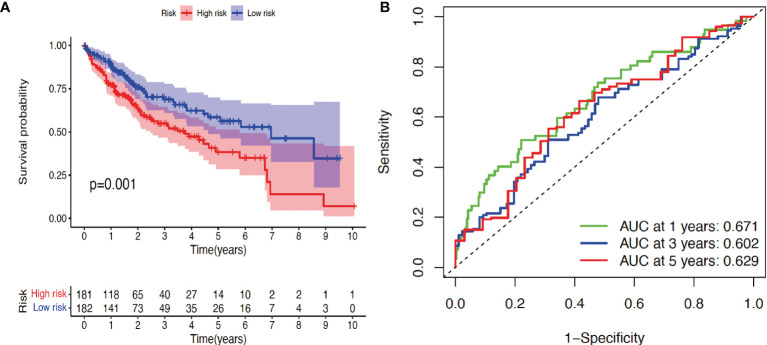
Figure 2.
Validation of prognosis model. (A) Kaplan–Meier survival curve analysis of high-risk and low-risk cohorts using package survival. (B) Receiver operating characteristic (ROC) analysis of three different survival times (1, 3, and 5 years) using timeROC and ggplot2 packages. AUC: area under the curve. p < 0.05 indicates statistical significance.

