Figure 5.
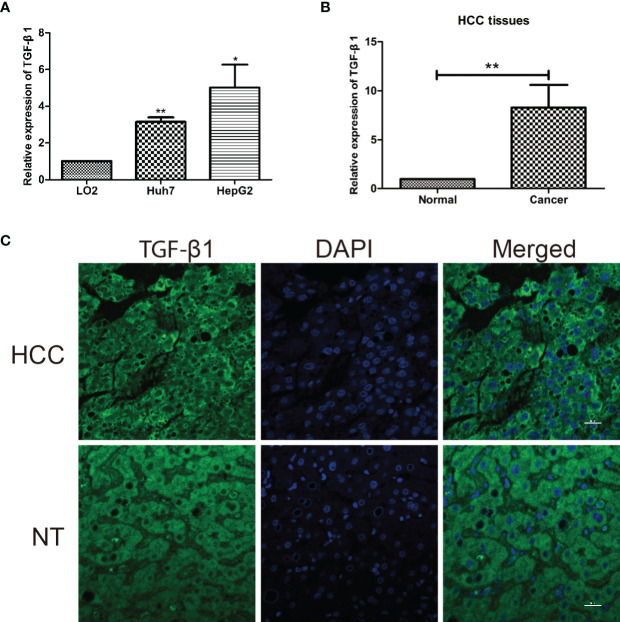
TGF-β1 is highly expressed in HCC cell lines and tissues. (A) Relative mRNA expression of TGF-β1 in normal human hepatic cell line (LO2) and two human HCC cell lines (Huh7 and HepG2). TGF-β1 gene expression is shown as the mean ± SD of three independent experiments. (B) Relative mRNA expression of TGF-β1 in HCC tissues is significantly higher than that in the paired neighboring non-tumor tissues. TGF-β1 gene expression is shown as the mean ± SD of fifteen tissue pairs. β-ACTIN was used as an internal control in RT-qPCR (**p < 0.01, Student’s t-test). (C) Microscopic images show liver cross-sections of paired para- and cancerous biopsies. TGF-β1 protein level (green) was visualized by indirect immunofluorescence staining, while nuclei DNA (blue) by DAPI staining. The images are representatives from three pairs of HCC and non-tumorous neighboring tissues. HCC, hepatocellular carcinoma; NT, neighboring non-tumorous tissue from the same HCC patient. *P < 0.05.

