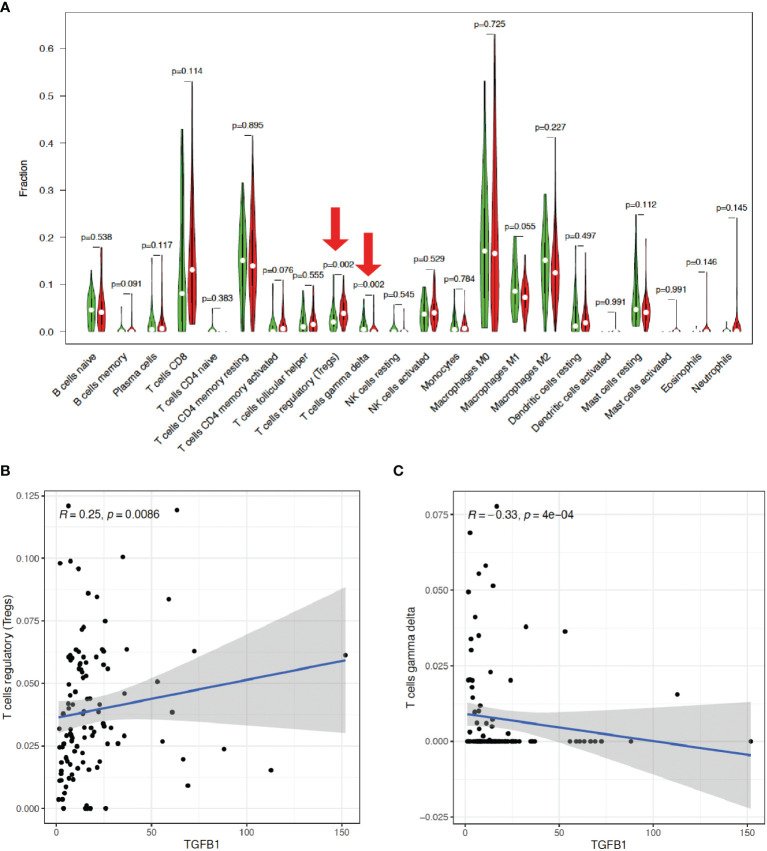
Figure 8.
TGF-β1 expression is positively correlated with Tregs, but negatively correlated with γδ T cells. (A) Differential analysis of the percentage (y-axis) of the 22 types of immune cells (x-axis) in HCC patients with high (indicated by red violins) or low (indicated by green violins) TGF-β1 expression by using limma and vioplot packages. The red arrows suggested statistical significance (p < 0.05). Correlation analysis of TGF-β1 expression with Tregs (B) and γδ T cells (C) by using limma, ggplot2, ggpubr, and ggextra packages. One black dot indicates one HCC sample. The blue lines indicate positive (B) or negative (C) correlation between TGF-β1 expression and immune cell percentage. R: correlation coefficient. p < 0.05 suggests significant correlation between TGF-β1 expression and immune cell percentage.

