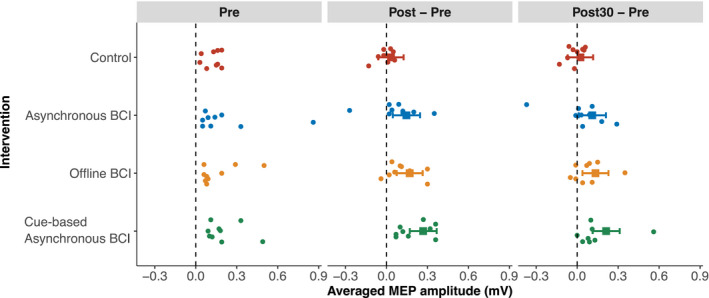
Figure 2.

Averaged peak‐peak MEP amplitudes in millivolts of individual participants. The pre‐intervention MEP amplitudes are subtracted from the post‐ and post30‐intervention MEP values to highlight the pre‐ to post‐ and post30‐intervention change. The means and 95% confidence intervals estimated from the statistical model are also presented with squares and interval lines.
