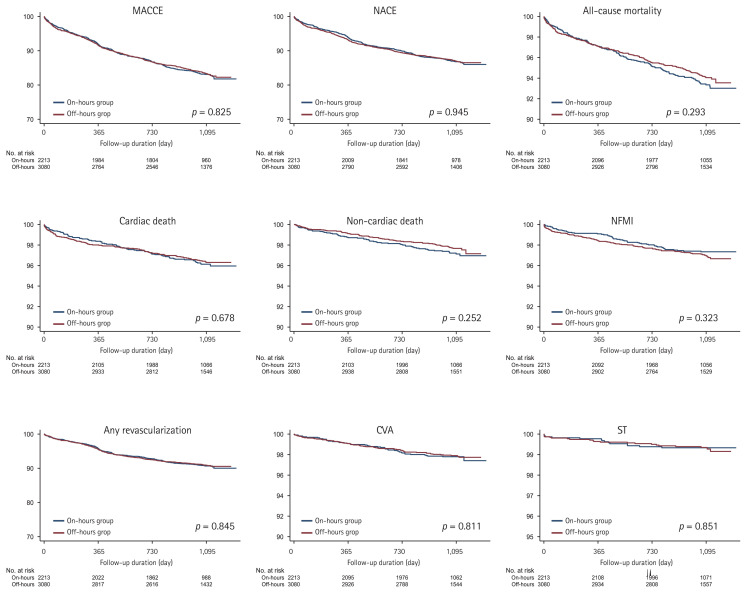
Figure 2.
Event rates of primary and secondary outcomes for all the patients after a 3-year follow-up (before inverse probability of treatment weighting-adjusted analysis). The figure shows the Kaplan-Meier curves for cumulative event rates according to the timing of primary percutaneous revascularization. MACCE, major adverse cardiac and cerebrovascular event; NACE, net adverse clinical event; NFMI, non-fatal myocardial infarction; CVA, cerebrovascular accidents; ST, stent thrombosis.

