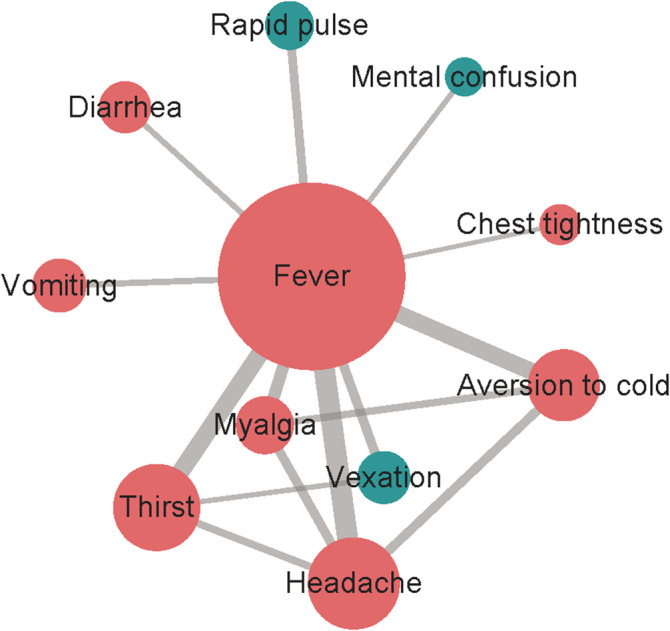
FIGURE 2.

The network of the common manifestations in medical records. The red circles represent the manifestations of COVID‐19, while the green circles represent the non‐COVID‐19 manifestations. The size of the circles represent the frequency of the manifestation. The width of the lines represents the co‐occurrence frequency of the two connected manifestations. The support was degree ≥ 10%
