. 2018 Jul 18;8(45):25835–25845. doi: 10.1039/c8ra04700f

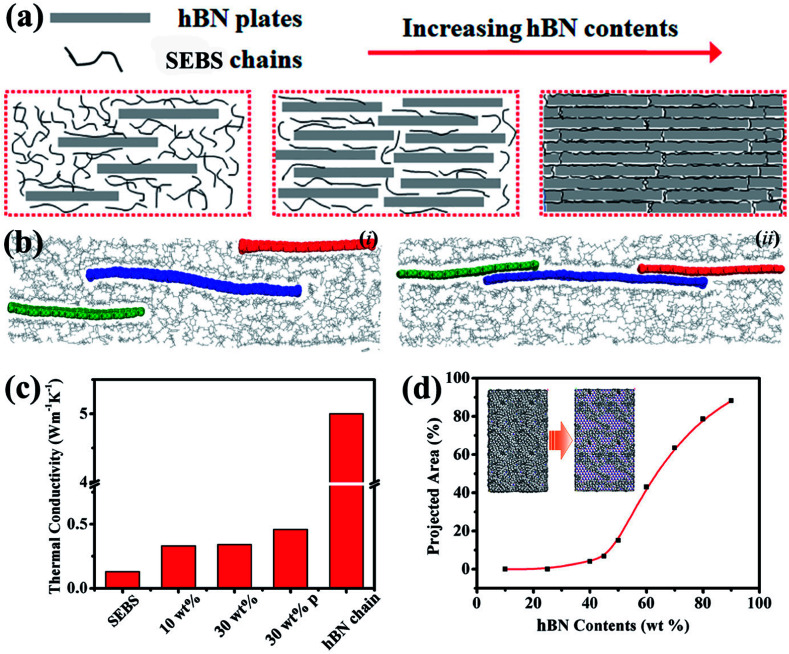
Fig. 5. (a) Schematic models of various dispersion types of hBN plates in a SEBS matrix; with increasing hBN plate contents, heat-transfer pathways were established in the matrix. (b) Molecular dynamics simulations models: (i) the heat-transfer pathways were not constructed by hBN. (ii) The heat-transfer pathways were constructed by hBN. The red, blue, and green colors present three individual hBN molecules, and the gray presents the SEBS matrix. (c) Molecular dynamics simulation for computing thermal conductivity of different structures. The 10 wt% and 30 wt% represented the hBN contents. The “p” in “30 wt% p” represented the formation of heat-transfer pathways. When the hBN projected area was not equal to zero, it meant that an hBN chain could be constructed. (d) Variations of the projected area occupied by hBN from the top-view with hBN contents, the inset presents the models from the top-view of hBN-based composites with 25 wt% and 50 wt% hBN. When the hBN content was 25 wt%, the hBN could not overlap. When the content increased to 50 wt%, heat-transfer pathways were established.

Fig. 5