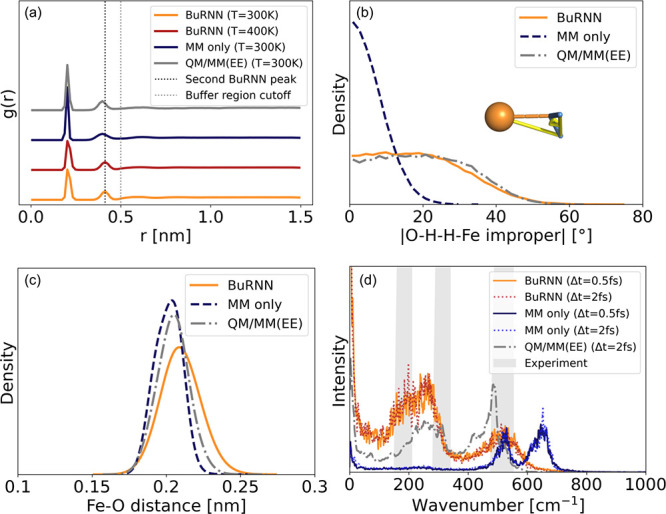
Figure 3.

Coordination of Fe3+ by water molecules with BuRNN simulations and when using MM only. (a) Radial distribution function for BuRNN at temperatures of 300 and 400 K, with MM only and a QM/MM simulation using electrostatic embedding (EE). The dashed lines indicate the second BuRNN peak and the cutoff used to define the buffer region. (b) Probability distribution of the O–H–H–Fe improper dihedral. (c) Distribution of the Fe–O distance. (d) Power spectrum of the Fe–O coordinative bond for different simulations. Experimental data were taken from refs (50−52).
