
Figure 3. Comparison of word pairings between doctors and non-doctors.
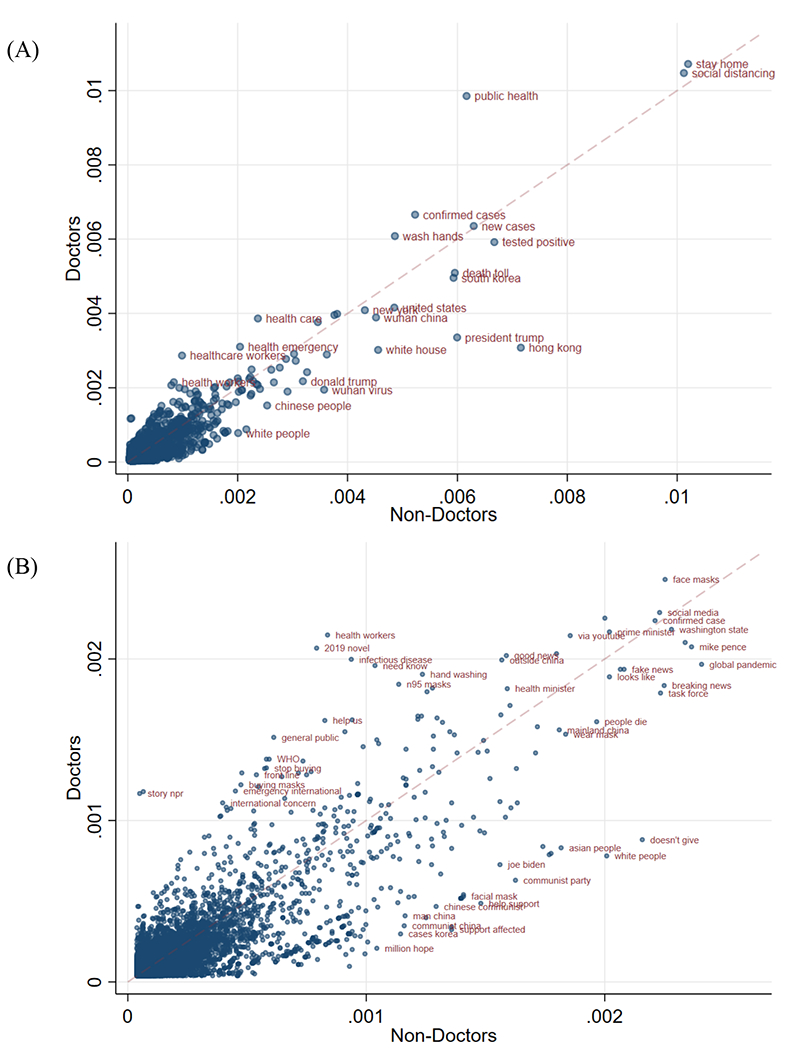
Note. Figure shows word pairings appearing in > 10 tweets, plotted based the proportion of tweets by doctors (n = 265,412) and non-doctors (n = 268,301) that include the word pair. We exclude synonyms for COVID-19. Panel A shows the entire universe of word pairings. Panel B is a magnified view of less common terms. Text labels show terms with high prevalences in both groups or large differences between groups.