
Figure 4. Significant differences in word pairings between doctors and non-doctors.
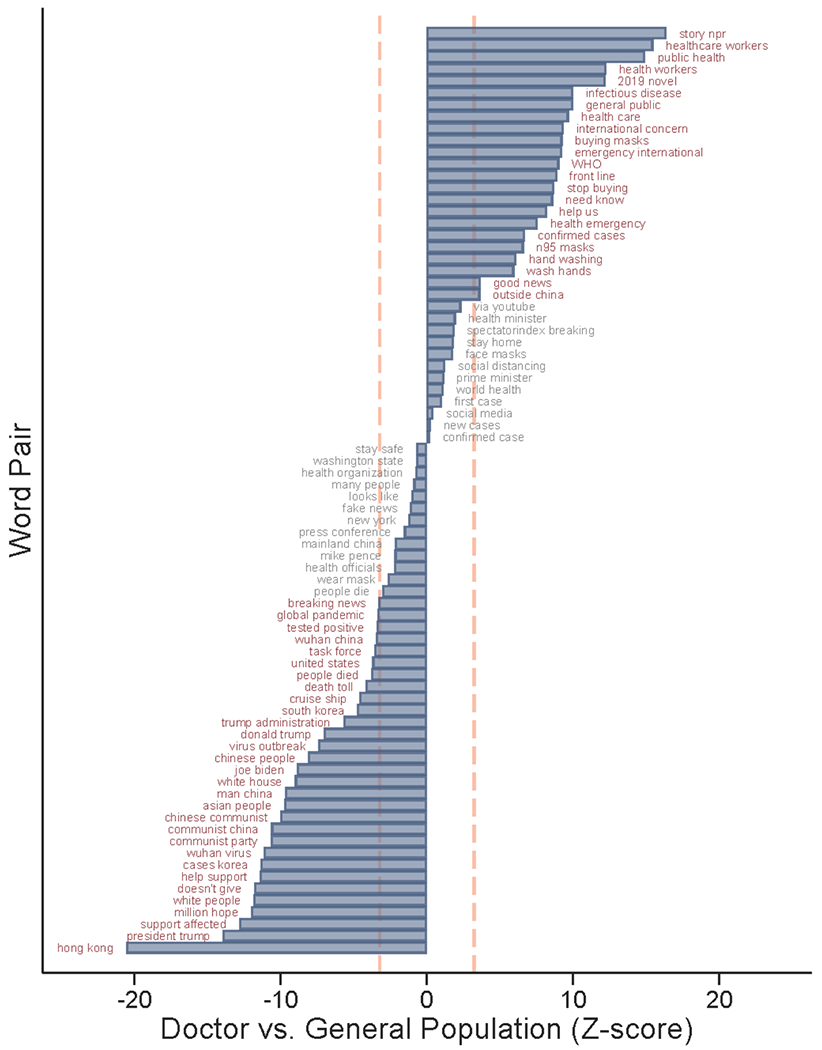
Note. Figure shows results from tests for statistically significant differences in prevalence for 78 selected word pairings. Y-axis shows word pairings with high prevalence among both doctors and non-doctors or large differences in prevalence between doctors and non-doctors. X-axis shows the Z-score from t-tests comparing word-pair prevalence between doctors and non-doctors, with positive Z-scores indicating significantly higher prevalence among doctor tweets and negative Z-scores indicating significantly higher prevalence among non-doctor tweets. The dashed vertical lines indicate the Bonferroni-corrected significance threshold for a family-wise error rate of 0.05. Word-pairings reaching Bonferroni-corrected significance are labeled in red; others are labeled in grey.