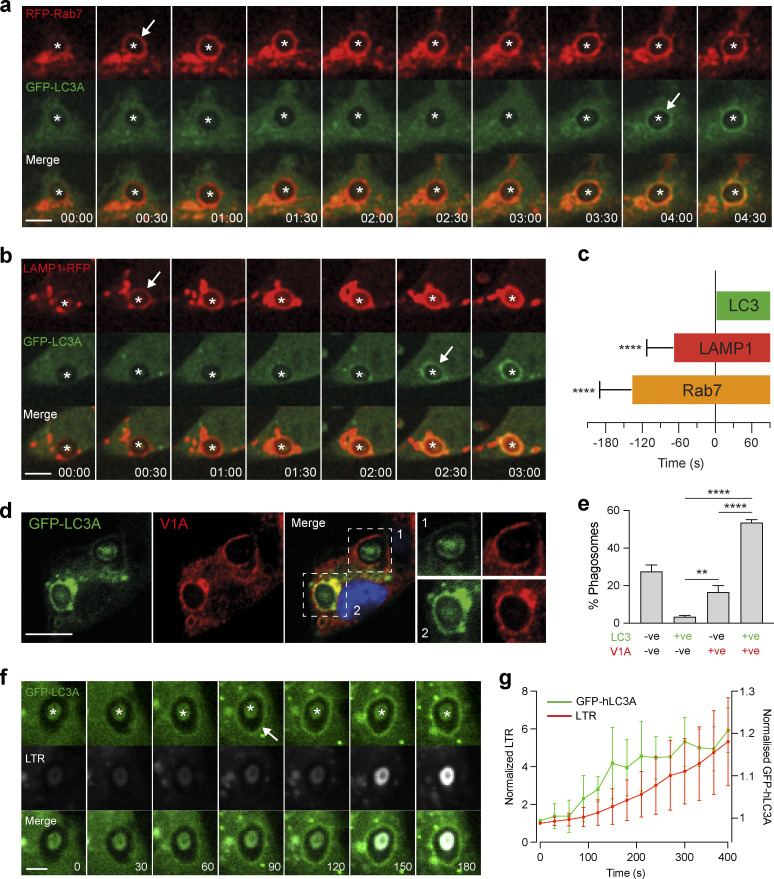
Figure 1.
Rab7, LAMP1, and V-ATPase recruit prior to LC3 during LAP. (a and b) Representative time-lapse confocal microscopy images of OPZ phagocytosis in RAW264.7 cells expressing GFP-hLC3A and RFP-Rab7 (a) or LAMP1-RFP (b). Asterisks denote phagosomes and arrows mark acquisition of fluorescent markers. Scale bar, 5 μm, cropped box, 5 μm; time, min:s. (c) Quantification of fluorescent marker acquisition from 10 phagosomes in relation to GFP-hLC3A (time 0). Data represent mean ± SD. ****, P < 0.0001, unpaired t test. (d) Confocal images of OPZ containing phagosomes after 20 min, stained for GFP-hLC3A and ATP6V1A. Scale bar, 5 μm. (e) Quantification of phagosome markers from d. Data represent mean ± SEM from three independent experiments with >100 phagosomes analyzed per experiment. ****, P < 0.0001; **, P < 0.001, one-way ANOVA followed by Tukey multiple comparison test. (f) Representative time-lapse confocal microscopy images of LTR and GFP-hLC3A during OPZ phagocytosis. Asterisks denotes phagosomes and arrow marks acquisition of GFP-hLC3A. Scale bar, 2 μm; time, s. (g) Quantification of phagosome markers from f. Data represent mean ± SD from eight phagosomes.

