Figure 3.
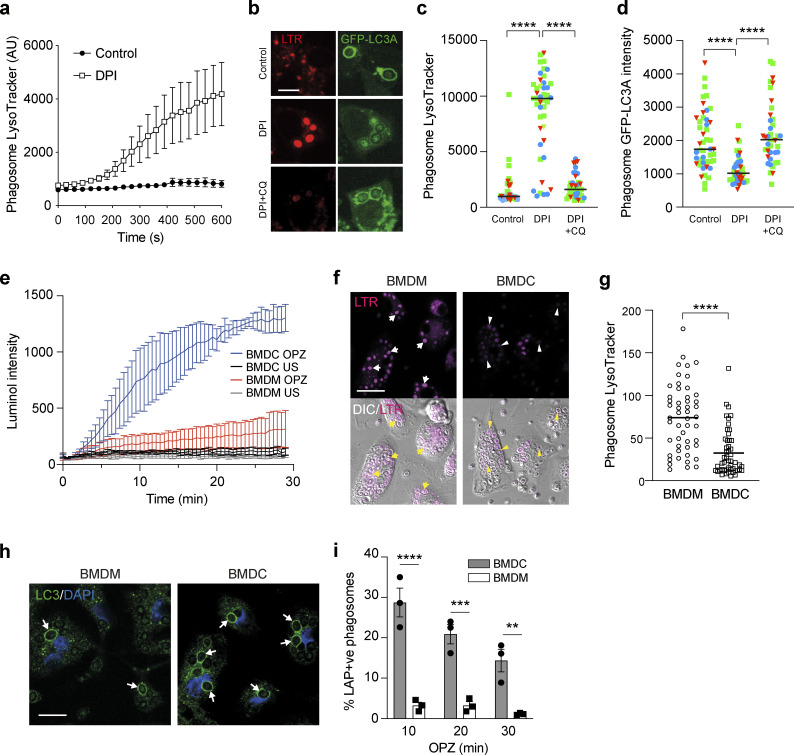
LAP induction involves elevated ROS and raised pH in phagosomes. (a) Confocal microscopy measurement of phagosome LysoTracker intensity over time in RAW264.7 cells stimulated with OPZ ± DPI (5 μM) pretreatment. Data represent mean ± SEM of nine individual phagosomes across multiple independent experiments. (b) RAW264.7 cells were pretreated with DPI (5 μM) or DPI + CQ (100 μM) prior to stimulation with OPZ for 25 min. Representative confocal images of LysoTracker and GFP-hLC3A are shown. Scale bar, 5 μm. (c and d) Quantification of Lysotracker (c) and GFP-hLC3A (d) at phagosomes in cells treated as in b. Data represent the mean of individual phagosome measurements from three independent experiments (red triangle, green square, blue circle). ****, P < 0.0001, one-way ANOVA followed by Tukey multiple comparison test. (e) Luminol measurements of ROS during OPZ phagocytosis in primary murine BMDC and BMDM cells. Data represent the mean ± SEM from three independent experiments. (f) Representative confocal images of LysoTracker staining and DIC in BMDC and BMDM cells after stimulation with OPZ for 25 min. Arrows denote phagosomes in BMDMs and arrowheads denote phagosomes in BMDCs. Scale bar, 20 μm. (g) Quantification of phagosome Lysotracker intensity in cells treated as in f. Data represent the mean of 50 individual phagosomes. ****, P < 0.0001, unpaired t test. (h) Representative confocal images of BMDC and BMDM cells stimulated with OPZ for 25 min and stained for LC3. Arrows denote LC3 positive phagosomes. Scale bar, 10 μm. (i) Quantification of LC3 positive phagosomes from cells stimulated with OPZ for the indicated times. Data represent mean ± SEM from three independent experiments. ***, P < 0.0001; ***, P < 0.0003; **, P < 0.003, two-way ANOVA with multiple comparisons. AU, arbitrary unit.

