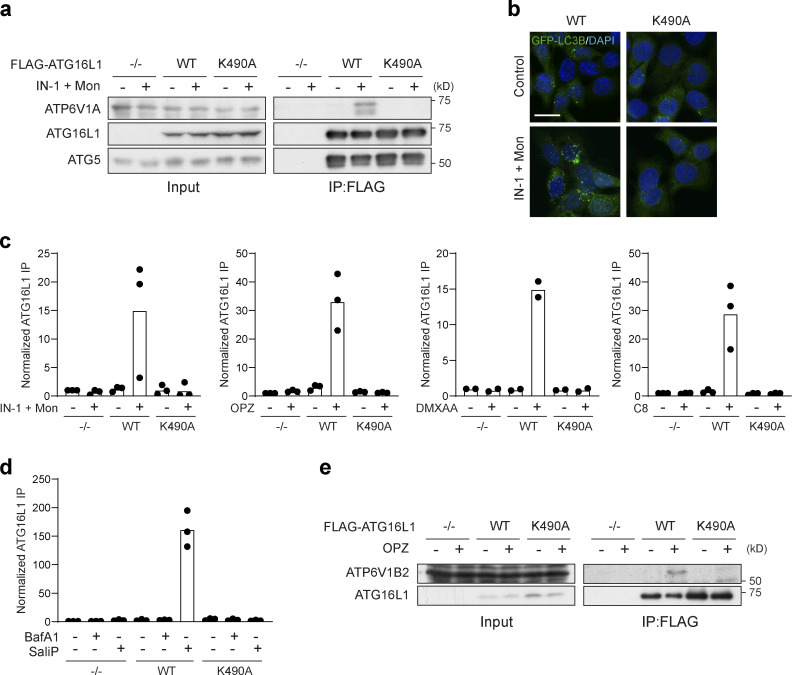
Figure S4.
Quantification of FLAG-ATG16L1 co-immunoprecipitation of V-ATPase subunits. (a) ATG16L1−/− HCT116 cells and those re-expressing FLAG-tagged WT and K490A ATG16L1 were treated with monensin (100 μM) + IN-1 (1 μM) for 45 min. Input lysates and FLAG immunoprecipitations were probed for ATP6V1A, ATG16L1, and ATG5 by Western blotting. (b) Confocal images of GFP-rLC3B HCT116 cells expressing WT or K490A ATG16L1 treated as in a. Scale bar, 15 μm. (c and d) Quantification of ATP6V1A pulldown in Flag-ATG16L1 immunoprecipitations as shown in Fig. 7, a–d, and Fig. S4 a. Data represent means normalized to unstimulated controls from two to three independent experiments. (e) ATG16L1−/− RAW264.7 cells and those re-expressing Flag-tagged WT and K490A ATG16L1 were treated with OPZ for 25 min. Input lysates and Flag immunoprecipitations were probed for ATP6V1B2 and ATG16L1 by Western blotting. Source data are available for this figure: SourceData FS4.

