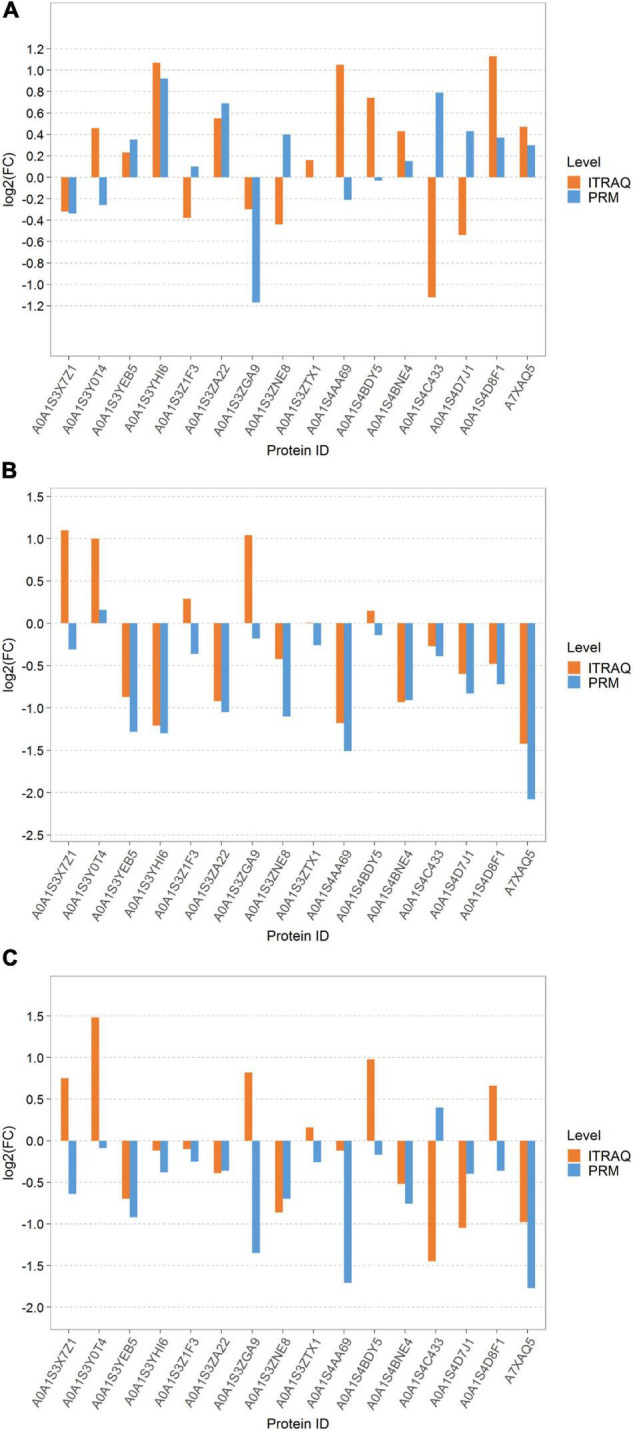
FIGURE 8.

Column map of parallel reaction monitoring (PRM) quantitative protein differences among different samples. (A) LS vs. PS; (B) LS vs. RS; and (C) PS vs. RS. The proteins corresponding to the column on the upside of the transverse axis 0 represent upregulated proteins, the proteins corresponding to the column on the underside of the transverse axis 0 represent downregulated proteins, numbers on columns represent multiple differences (non-logarithmic), for example: if the number in the underside column is 2, the WM is two times as much as the IM in the expression level; if the number in the upside column is 2, the WM is 0.5 times as much as the IM in the expression level.
