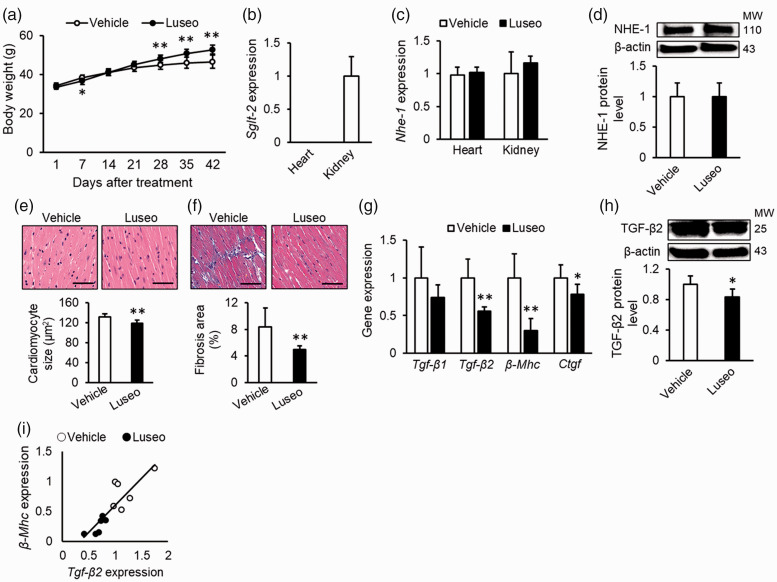
Figure 2.
Effects of luseogliflozin treatment on cardiac hypertrophy and fibrosis in diabetic mice with obesity. High-fat-fed db/db mice were treated with vehicle or luseogliflozin for 6 weeks. (a) Body weight changes after treatment. (b) Cardiac mRNA levels of Sglt2. Data of the kidney were used as a positive control for SGLT2. (c) Cardiac mRNA levels of Nhe-1. (d) Cardiac protein levels of NHE-1. Upper panels show the representative immunoblot images. (e) Cardiomyocyte sizes. (F) Interstitial fibrosis area. Upper panels show the representative microscopic images of left ventricle stained with hematoxylin and eosin (E) and Masson’s trichrome (f). Scale bars, 1 mm. (g) Cardiac mRNA levels of Tgf-β1, Tgf-β2, β-Mhc, and Ctgf. (h) Cardiac protein levels of bioactive dimetric TGF-β2. Upper panels show the representative immunoblot images. (i) Correlation between gene expression levels of Tgf-β2 and β-Mhc. (a), (e), (f): Vehicle, n = 9, Luseogliflozin, n = 10; (b), (c): n = 4 per group; (d): n = 5 per group; (g), (i): n = 6 per group; (h): Vehicle, n = 5, Luseogliflozin, n = 6. Gene and protein expression levels of target molecules were normalized to those of the internal controls 18s rna and β-actin, respectively; the data were shown as relative levels to the vehicle. NHE-1, sodium-hydrogen exchanger-1; TGF, transforming growth factor; SGLT2, sodium-glucose cotransporter-2; β-Mhc, myosin heavy chain beta; Ctgf, connective tissue growth factor; MW, molecular weight; Luseo, luseogliflozin. *p < 0.05 vs. vehicle, **p < 0.01 vs. vehicle.

