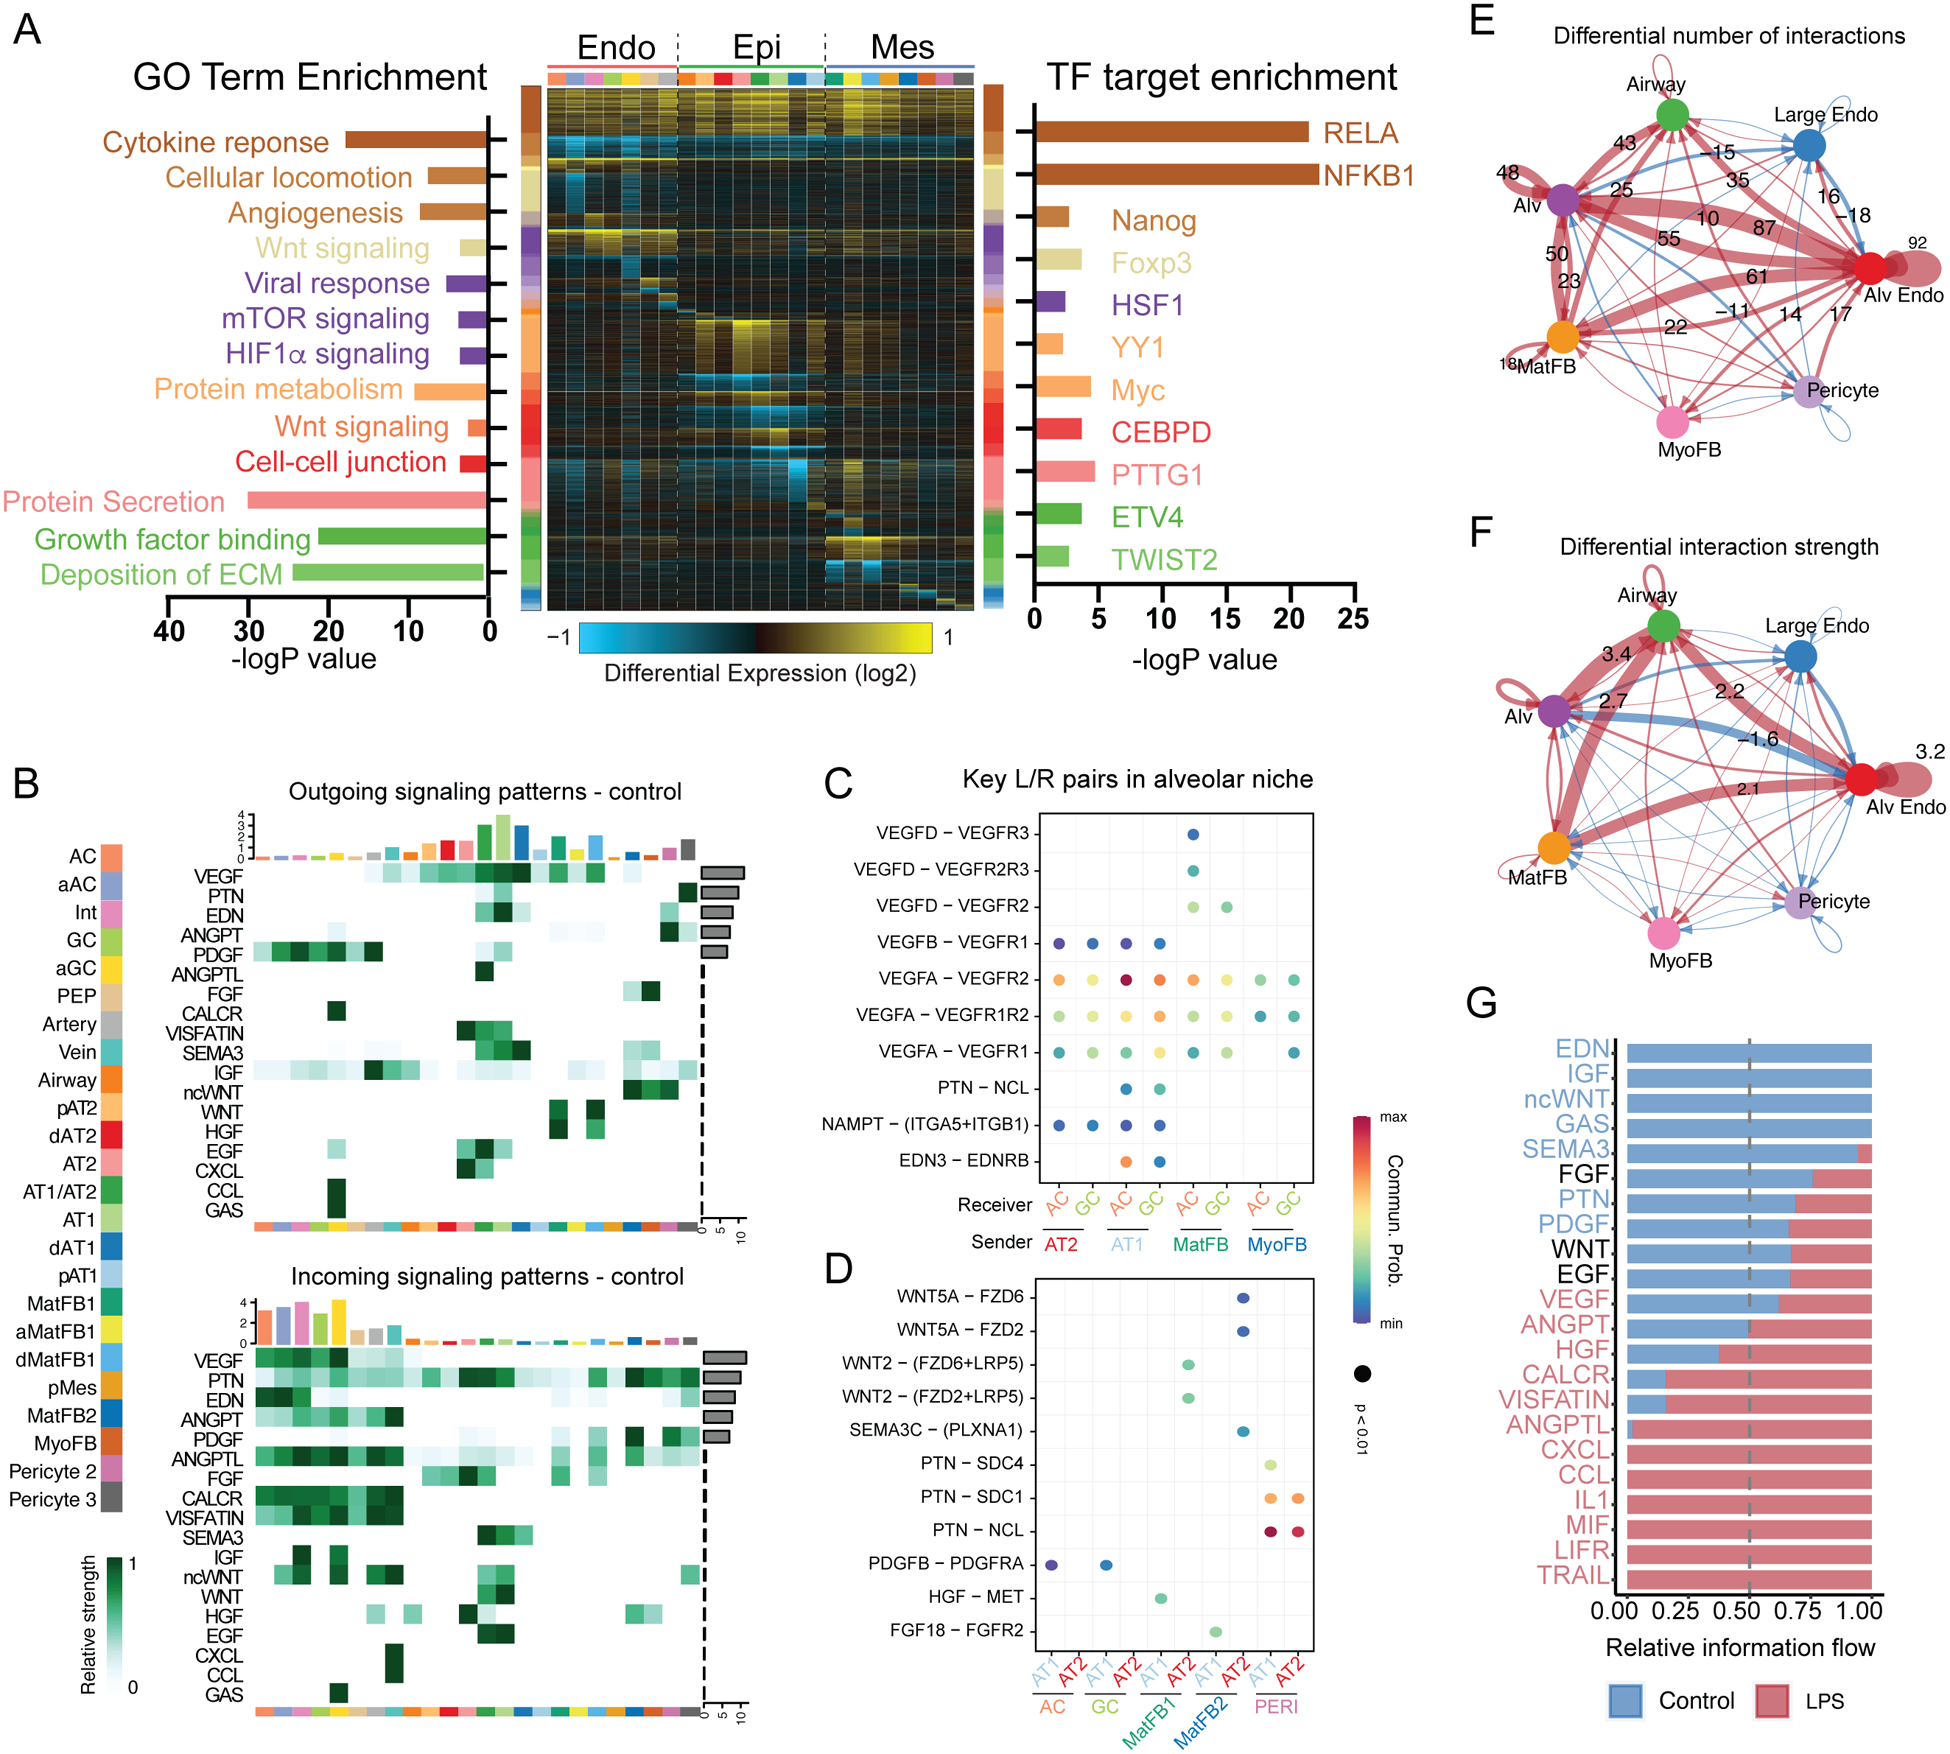
Figure 4. Inflammatory injury disrupts cellular and developmental niche signaling in the alveolus.

A) cellHarmony heatmap of LPS vs. control – differentially expressed genes (rows) for each cell population (columns), highlighting GO terms enriched in each gene set (left), and experimentally observed TF-target gene-module enrichment (right). Cell types colored as indicated in the sidebar. Y axis bar colors are based on differentially expressed gene sets, and bar size is the −log(p-value) for enrichment in that gene set. B-G) CellChat analysis of signaling milieu of the developing alveolus. B) Major ligand/receptor (L/R) relationships displayed as heatmap showing outgoing ligands (top) and incoming receptivity (bottom), with overrepresented signaling pathways (left Y axis), cell identity (bottom X axis, colors corresponding to sidebar cell identity), relative strength of the predicted signaling pathway in the overall network (right Y axis), and relative contribution of the cell population to the overall signaling milieu (top X axis). C-D) Key L/R interactions (L/R pair [Y axis]; sender/receiver cells [X Axis]) targeting ACs and general capillaries (C) or AT1 and AT2 cells (D). E-G) Changes in signaling milieu of LPS-treated lung - increased signaling in control (blue); increased signaling with LPS (red). Significant increases in number (E) and strength (F) of interactions occur with LPS, with shift from developmental signaling pathways enriched in the baseline alveolar niche to increased inflammatory signaling in the damaged alveolar niche (G). Cell identity abbreviations same as Figure 3. ECM = extracellular matrix.
