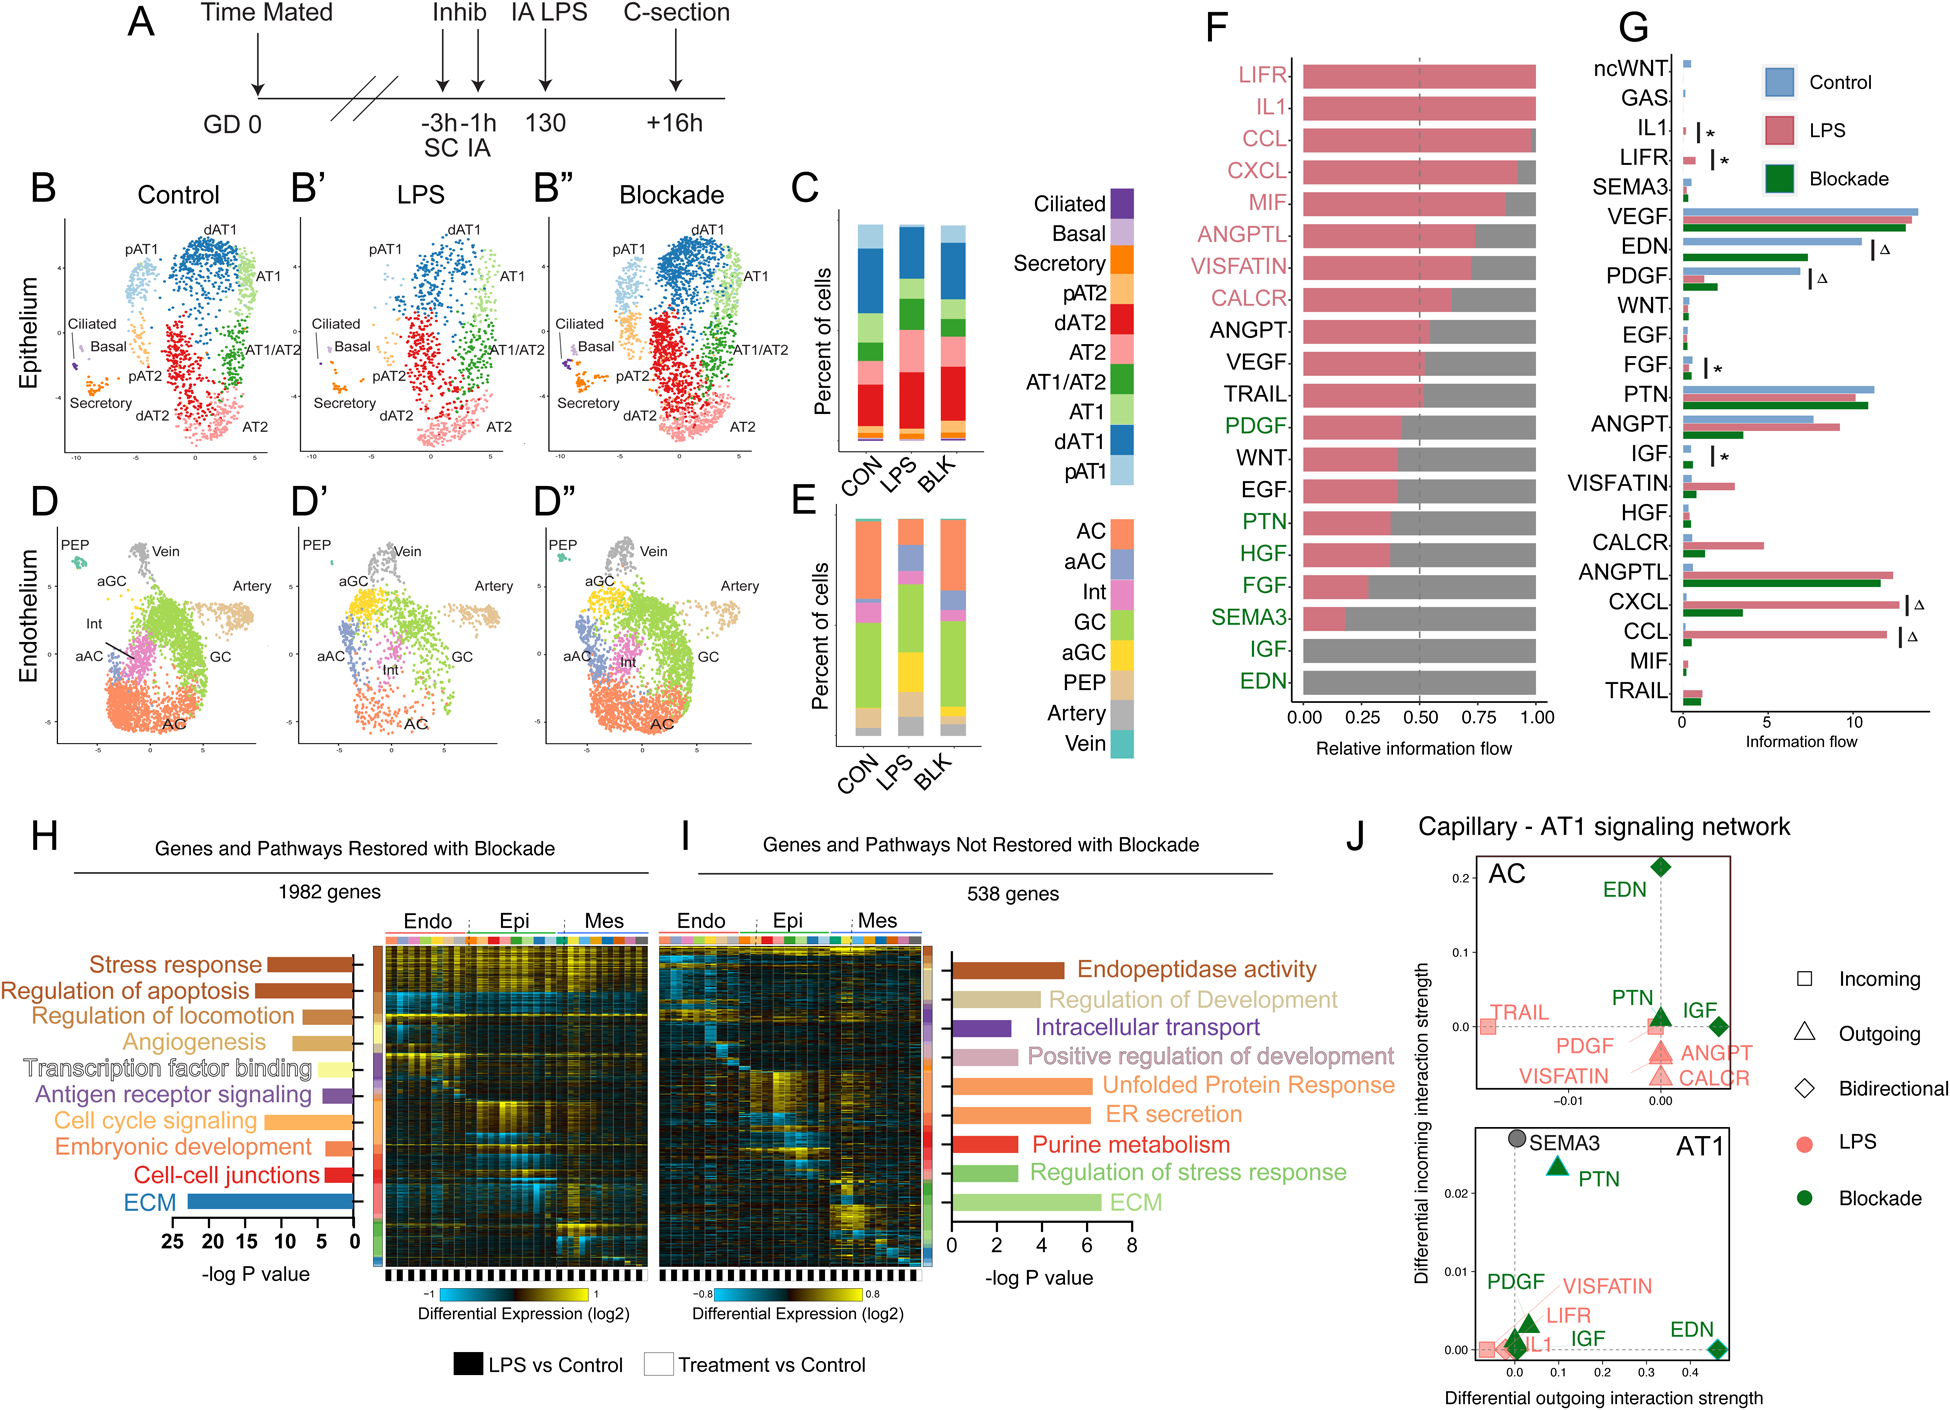
Figure 6. Combined IL-1 and TNF blockade maintains cellular quorum and alveolar niche signaling during LPS-mediated inflammatory injury.

A) Experimental design, as in Figure 5. B-E) UMAP of epithelial (B) and endothelial (C) cell clusters from control (n=2, B, D, as in Fig 3), LPS-treated (n=2, B’, D’, as in Fig 3) and combination blockade (n=3, B”, D”) animals. C, E) Relative proportions of each cell type. F) CellChat analysis of the alveolar signaling milieu after blockade compared to LPS – enriched signals in LPS (red text); enriched signals in combined blockade (green text). Lung stromal signaling milieu reverts markedly compared to LPS treatment. FGF, HFG, pleiotrophin, and endothelin signaling improve with blockade. G) Comparison of intensity of major signaling pathways in control, LPS, and blockade conditions demonstrates normalization of some pathways (* = not significantly different than control, p>0.05 for control vs blockade) while others improve but do not normalize (Δ = significantly improved from LPS, but significantly elevated compared to control, p<0.05 for comparison to LPS and comparison to control), including most inflammatory pathways. H-I) GO term and pathway analysis of differentially regulated genes by cellHarmony, delineating the global effect of combination blockade. Genes and pathways are highlighted which revert (H) or do not revert (I) to near baseline expression with blockade. J) CellChat evaluation of AT1-AC interactions with LPS and following blockade.
