. 2018 Jul 20;8(46):26078–26088. doi: 10.1039/c8ra03693d

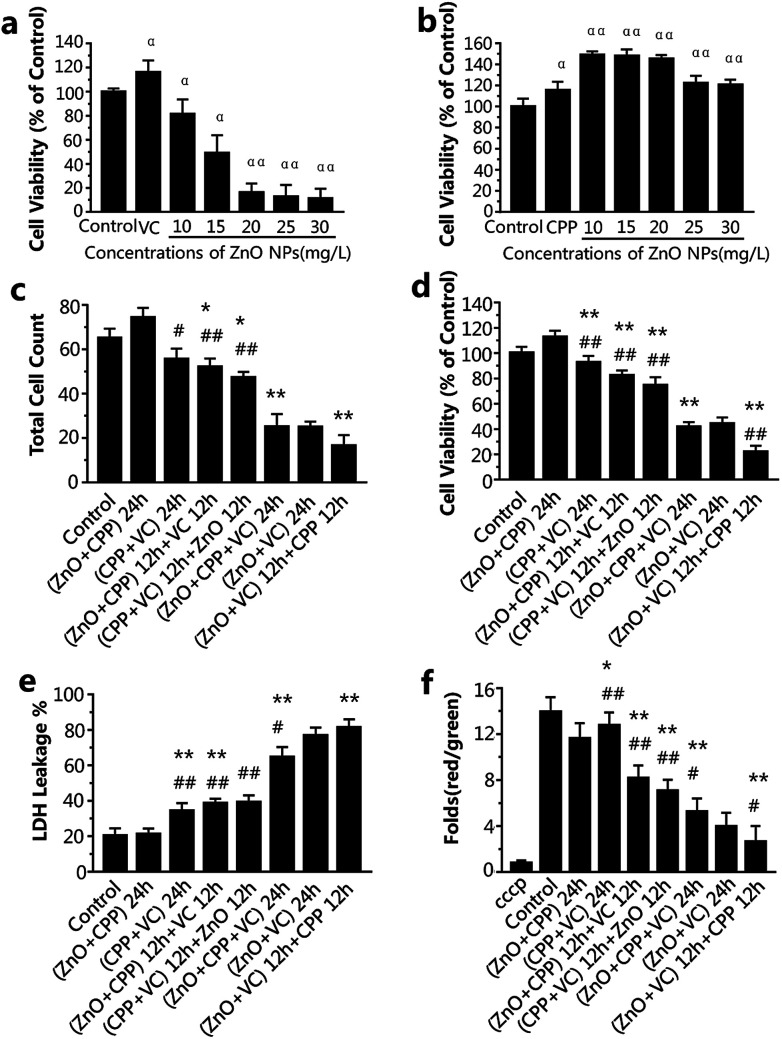
Fig. 2. Cytotoxicity evaluation after treatment with the different combined groups of ZnO NPs, CPP and VC for 24 h. (a) Cell viability analysis after incubation with VC (300 mg L−1) and different concentrations (mg L−1) of ZnO NPs. (b) Cell viability analysis after incubation with CPP (500 mg L−1) and different concentrations (mg L−1) of ZnO NPs. (c) Cell counts, (d) cell viability analysis, (e) the effects on LDH release, (f) changes in Δψm of cells in electric pulses (cells were treated with cccp (C9H5ClN4) as the positive control). Data are presented as the mean ± S.D. αP < 0.05 compared with the control group. ααP < 0.01 compared with the control group. *P < 0.05 compared with the ZnO NPs plus CPP group. **P < 0.01 compared with the ZnO NPs plus CPP group. #p < 0.05 compared with the ZnO NPs plus VC group. ##p < 0.01 compared with the ZnO NPs plus VC group.

Fig. 2