. 2018 Jul 20;8(46):26188–26200. doi: 10.1039/c8ra04627a

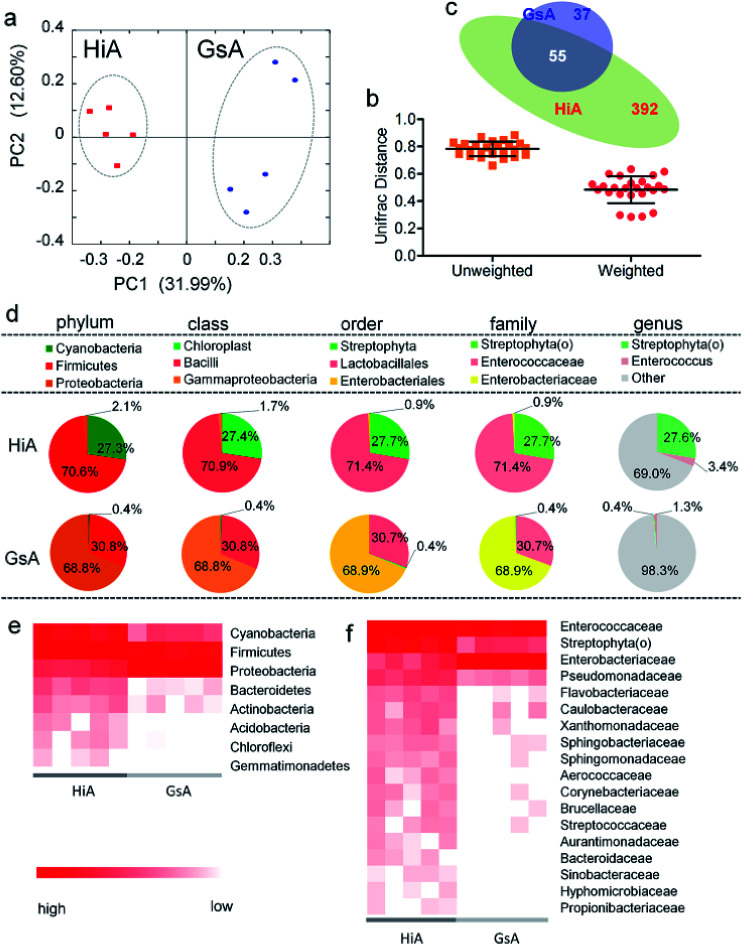
Fig. 4. Gut microbiota relative abundance in the two silkworm strains that were reared on the artificial diet. (a) A PCoA based on unweighted UniFrac distances. (b) Average UniFrac distances of the GsA and HiA strains. (c) Venn diagram showing the unique and shared genera. (d) 16S rDNA gene survey of the gut microbiotas. Relative abundance of the members of the gut microbiotas reported at the phylum, class, order, family, and genus levels. The pie charts are based on the proportion of OTUs per sample. Colors were assigned for all the samples detected, and for all microorganisms with a relative abundance ≥1% in at least 10% of the samples. (e) Phylum-classified and (f) family-classified microorganisms of the gut microbiota whose relative abundance differed between the HiA and GsA strains (P < 0.05, n = 5).

Fig. 4