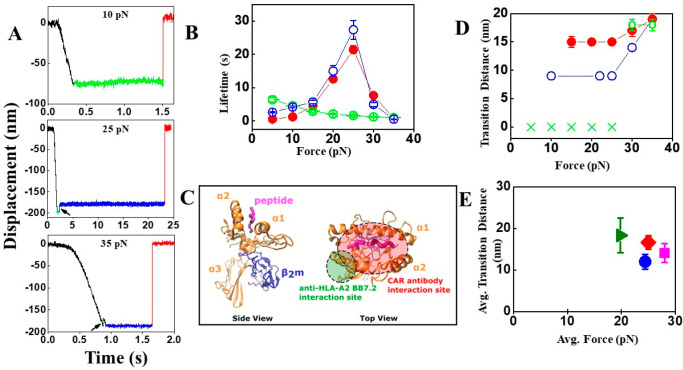
Figure 4.
SM results of LMP2 CAR antibody/antihuman HLA-A2–LMP2/A*0201 interactions. (A) Representative SM traces of LMP2 CAR antibody–LMP2/A*0201 (10, 25, and 35 pN) interaction. Traces containing conformational transitions at 25 and 35 pN are indicated by black arrows. “Pre-transition” and “Post-transition” dwells are shown in green and blue colors, respectively. (B) Bond lifetimes of single LMP2 CAR antibody–LMP2/A*0201 (filled red circles) and antihuman HLA-A2 antibody (BB7.2)–LMP2/A*0201 (open green circles) are plotted as a function of force, showing catch and slip bond profiles, respectively. The open blue circles are SMSC results for the LMP2 CAR–LMP2/A*0201 interaction. Error bars depict SEM. (C) Probable interaction sites of CAR antibody (red ellipse) and antihuman HLA-A2 (BB7.2) (green circle) with HLA-A*0201. (D) Transition distance vs force plot for LMP2 CAR antibody–LMP2/A*0201 (filled red circles) and antihuman HLA-A2 antibody (BB7.2)–LMP2/A*0201 (open green circles and green crosses) interactions where transitions are found in 30 out of 56 and 10 out of 46 traces, respectively. The green crosses indicate no transition found. The open blue circles are SMSC results for the LMP2 CAR–LMP2/A*0201 interaction. Error bars depict SEM. (E) Plot of average transition distance vs average force for TCR (using SMSC; olive-green triangle), LMP2 CAR (using SMSC; blue circle), LMP1 CAR (using SMSC; magenta square), and CAR antibody (using SM; red rhombus). Error bars depict SEM.

