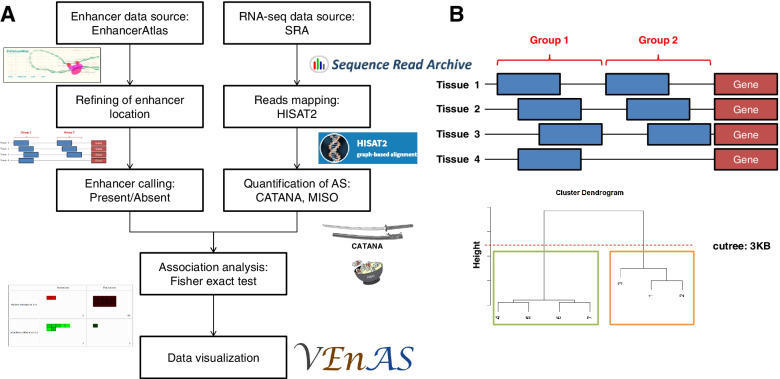
Fig. 1.
(A)Workflow or the analysis pipeline for identification of enhancer-AS associations. In the top left part of the analysis pipeline, we focused on enhancer datasets polish, including position refining and presence/absence calling. In the top right part, we focused on the processes for quantification of AS changes. We then conducted association analysis to identify enhancer-AS associations, and finally constructed a website called VEnAS for data visualization. (B) An example of refining enhancers between different tissues and cell lines.The blue boxes are representing to enhancers in different tissues or cell lines. The middle positions of enhancers are used for hierarchical clustering with centroid method. The cuttree threshold is set as 3 kilo bases. The green and orange boxes are representing to the two refined groups under the threshold

