
Fig. 2.
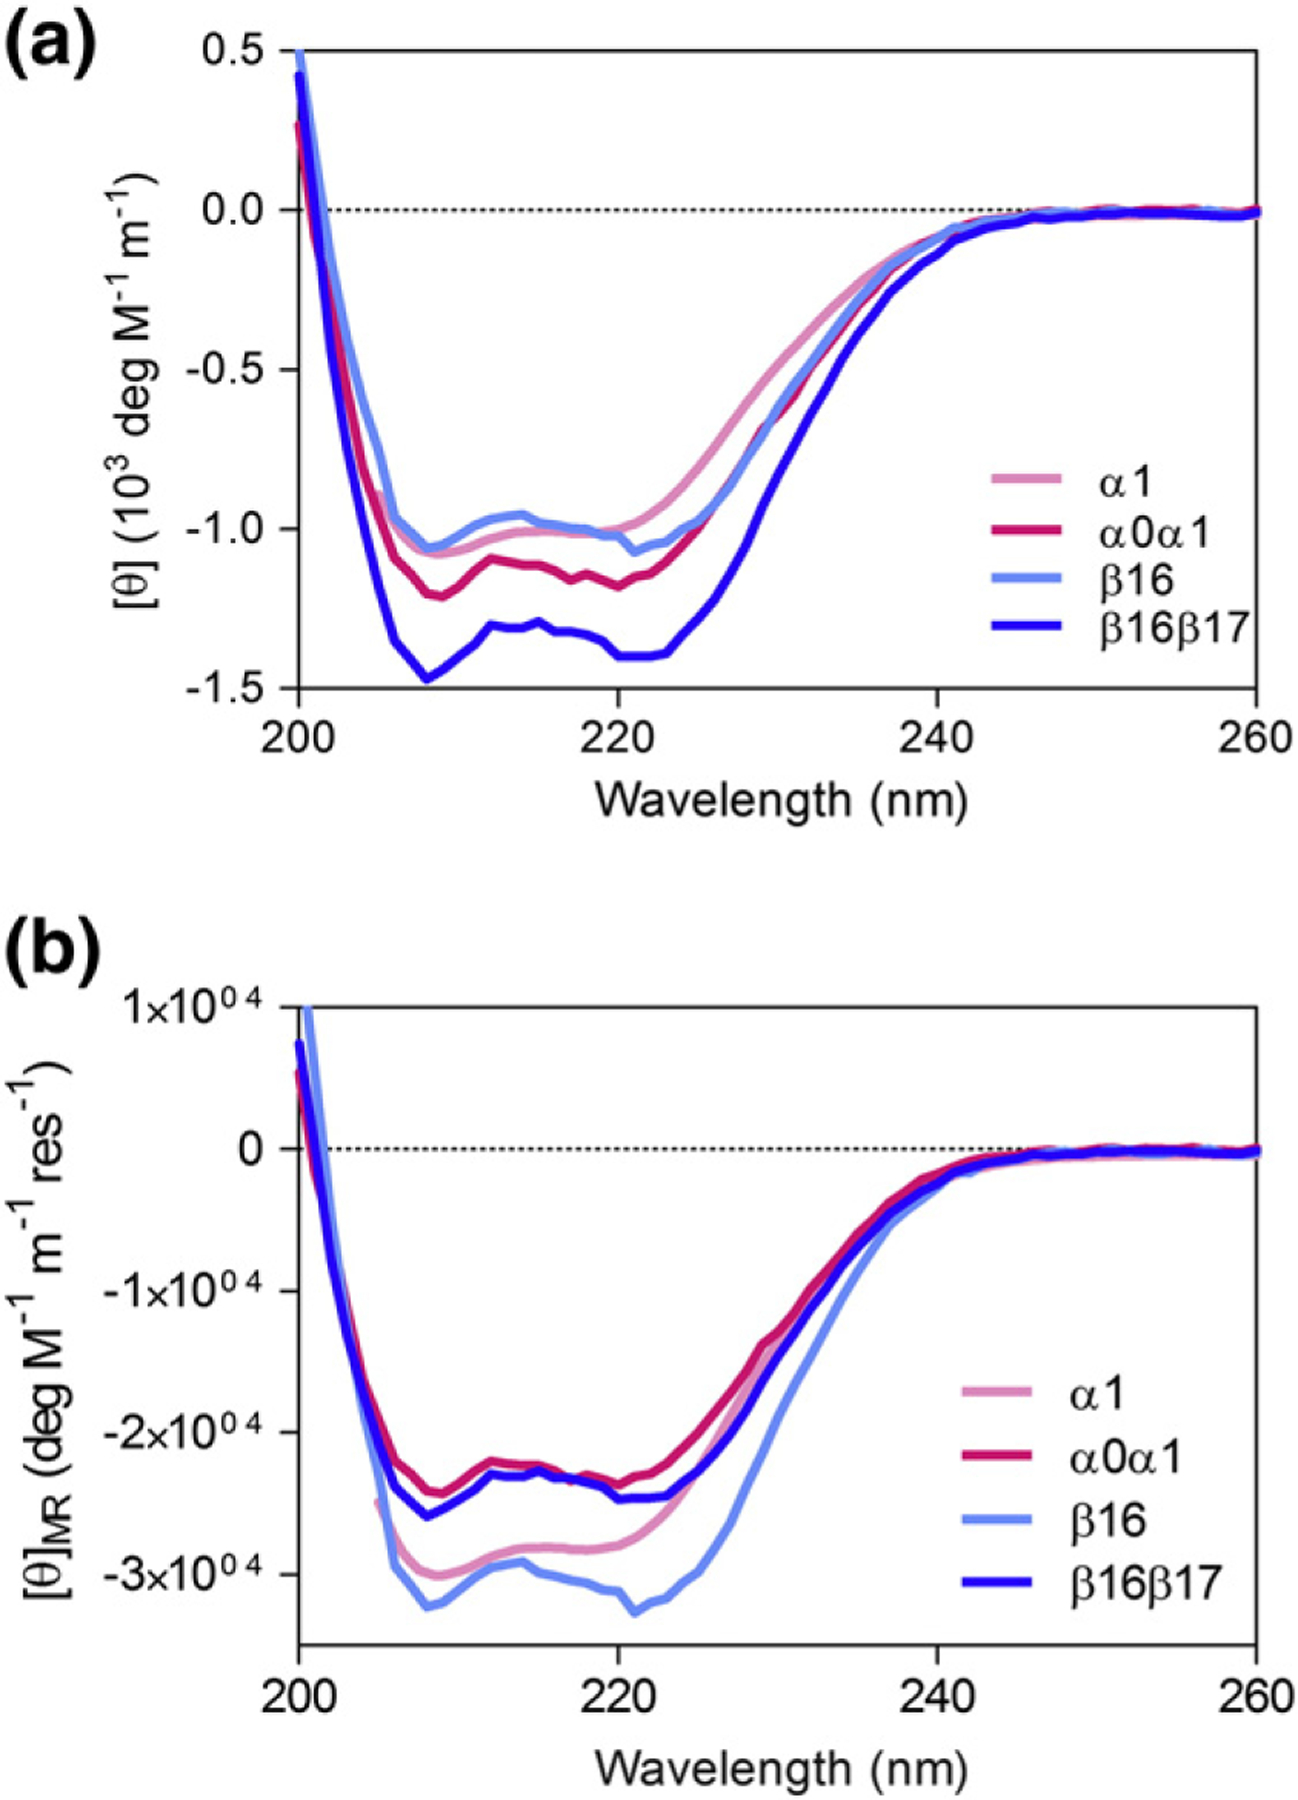
CD profiles for erythrocyte spectrin constructs. (a) Equal concentrations of α1 and β16 have similar CD spectra, as we might expect from 2 three-helix bundles of similar size. Addition of α0 to α1 and β17 to β16 shows an increase in overall helicity, suggesting that both α0 and β17 have some helical structure. (b) However, when we compare mean residue ellipticity (MRE), it is clear that the MRE values for α0α01 and β16β17 are significantly lower in magnitude than those for folded α1 and β16, respectively. Both tail regions are also significantly unstructured.