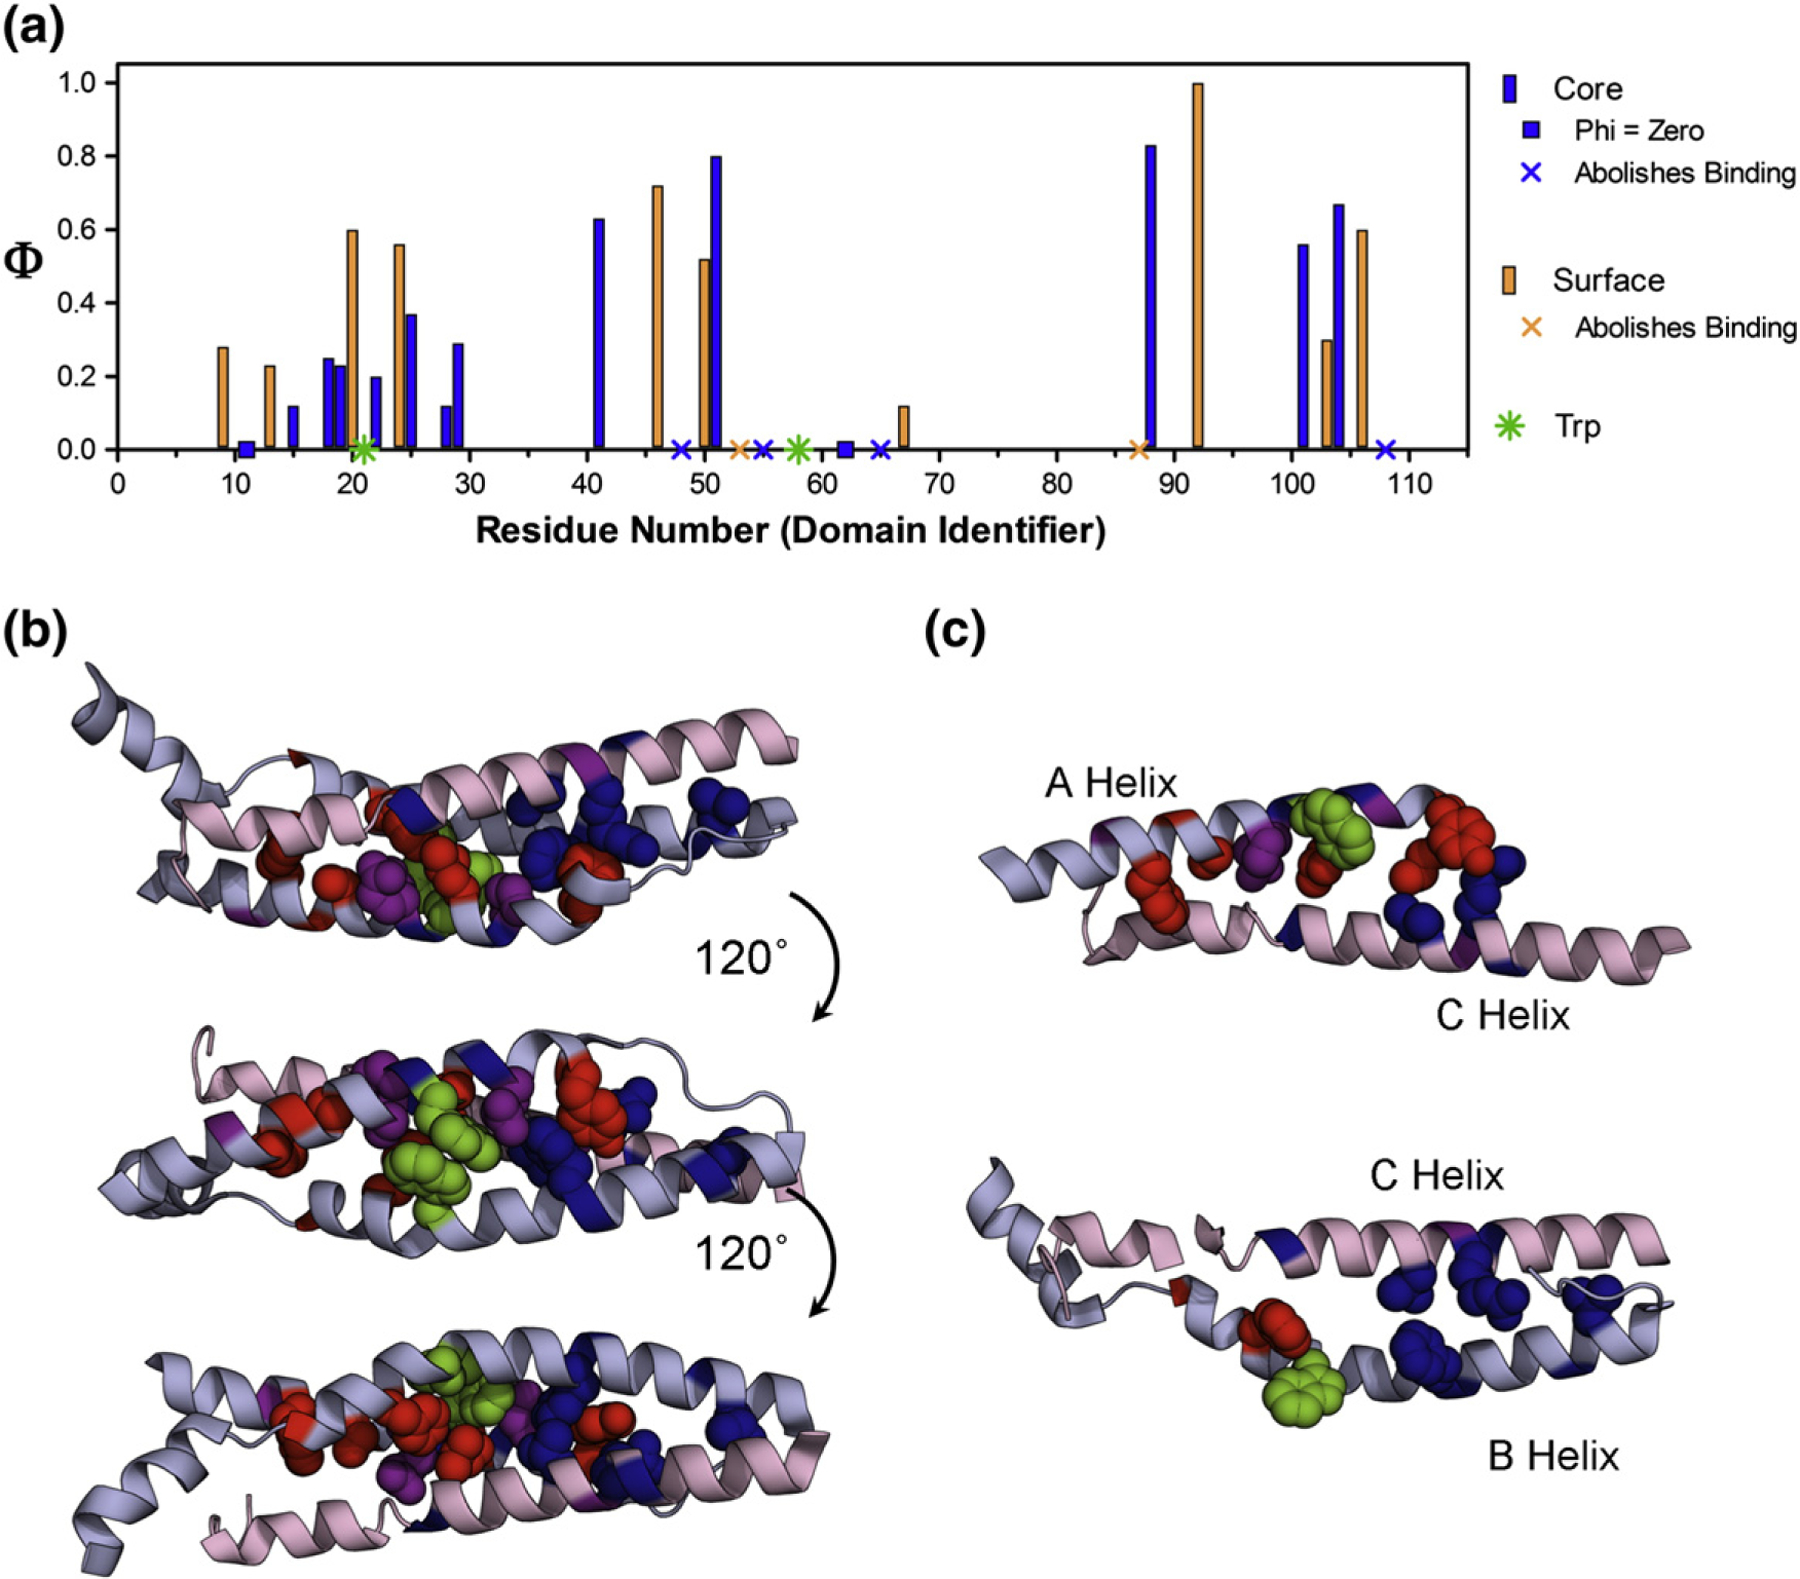
Fig. 5.

Results of Φ-value analysis. (a) The Φ-values form a coherent pattern when plotted against the sequence, covering a large range of both core (blue) and surface (orange) residues. The mutations that abolish binding are presented as symbols (x) in the appropriate color, and the two Trp residues, in Helices A and B, are shown as green symbols (✸). Peaks in the Φ-values for the A-helix (middle-to-C-terminal) and the B-helix (N-terminal-to-middle) indicate the most structured regions in β17 at the transition state. The Φ-values in the C-helix are more uniform. (b) Φ-values in the context of the structure of the spectrin tetramer are shown as spacefilling for core residues, while just the backbone is colored for surface residues (α1 and β16 have been removed for clarity). The Φ-values are divided as low (Φ < 0.25, red), medium (0.25 ≤ Φ < 0.5, purple), and high (Φ ≥ 0.5, blue). (c) Top, the A-helix and the C-helix are shown with their Φ-values in the absence of Helix B, which highlights the contact of high Φ-values in C-terminal Helix A with N-terminal Helix C at the transition state. The bottom structure shows only Helices B and C, where the contact between high Φ-values at the N-terminal end of Helix B with the C-terminal end of Helix C.
