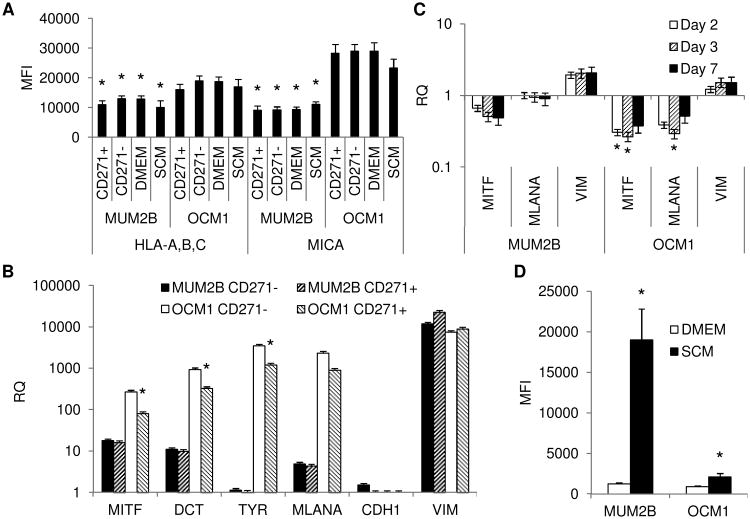
Figure 2.
(A) Expression of HLA-A,B,C and MICA by MUM2B and OCM1 cells enriched for CD271+ and CD271− fractions by magnetic cell sorting and when propagated as monolayers in DMEM (DMEM) or as melanospheres in stem-cell supportive media (SCM) for 3 days. Data represent mean fluorescent intensity (MFI) ± SD, n = 3. *, P <0.05 MUM2B vs. OCM1. (B) Levels of melanocyte differentiation determinants of MUM2B and OCM1 cells enriched for CD271+ and CD271− fractions by magnetic cell sorting. Data represent mean ± SD, n = 3. *, P <0.05 CD271+ vs. CD271−. (C) Levels of melanocyte differentiation determinants of MUM2B and OCM1 cells cultured in SCM for 2, 3, of 7 days compared to culture as monolayers in DMEM. Data represent mean ± SD, n = 3. *, P <0.05 SCM vs. DMEM. (D) Expression of CD271 by OCM1 and MUM2B propagated either as monolayers in DMEM or as melanospheres in SCM for 3 days. Data represent mean MFI ± SD, n = 3. *, P <0.05 SCM vs. DMEM.

