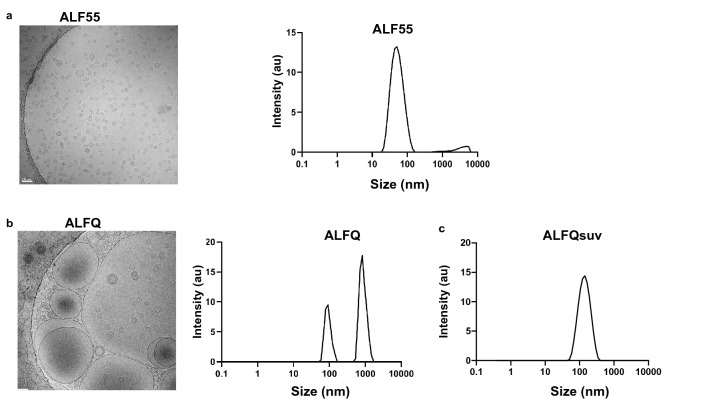
Figure 1.
Visualization and sizing of ALF55 and ALFQ. ALF55, ALFQ, and ALFQsuv samples were visualized by cryo-electron microscopy (cryo-EM) and size distributions were measured by dynamic light scattering analysis (DLS). (a) Shows EM of small unilamellar vesicles in ALF55 (left) and their narrow size distribution (right). (b) Shows EM of both small and large vesicles in ALFQ (left) and a wider size distribution of the small and some large vesicles (right). However, DLS is not suitable to capture the range of the large size particles in ALFQ. (c) Shows the narrow size distribution of the vesicles in ALFQsuv.

