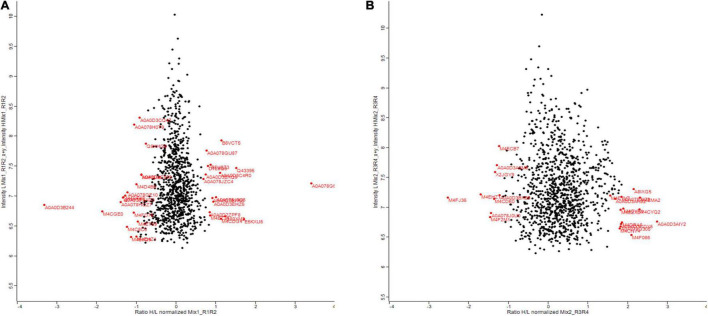
FIGURE 4.
Summary of the results comparing deep-scale proteome analysis data of Brassica napus variety (A) Faisal canola and (B) Shiralee using nano-flow LC-MS/MS data and data obtained by micro-flow LC-MS/MS data in this study. Red color indicates significantly altered proteins. The red on the right side of the scale starting from 0 shows an increase in protein expression while the red on the left side of 0 indicates the decrease in protein expression. Three different biological replicates were used in the study.

