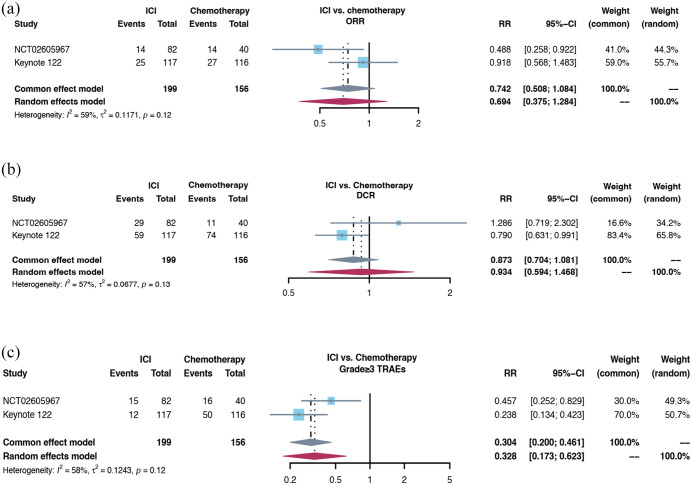
Figure 3.
The forest plot of ORR, DCR, and grade ⩾3 TRAEs incidence in comparison between ICI monotherapy and chemotherapy for R/M NPC: (a) the forest plot of ORR in comparison between ICI monotherapy and chemotherapy for R/M NPC. (b) The forest plot of DCR in comparison between ICI monotherapy and chemotherapy for R/M NPC. (c) The forest plot of grade ⩾3 TRAEs incidence in the comparison between ICI monotherapy and chemotherapy for R/M NPC.
DCR, disease control rate; ORR, objective response rate; TRAE, treatment-related adverse effect.

