. 2018 Jul 20;8(46):25888–25908. doi: 10.1039/c8ra04491k

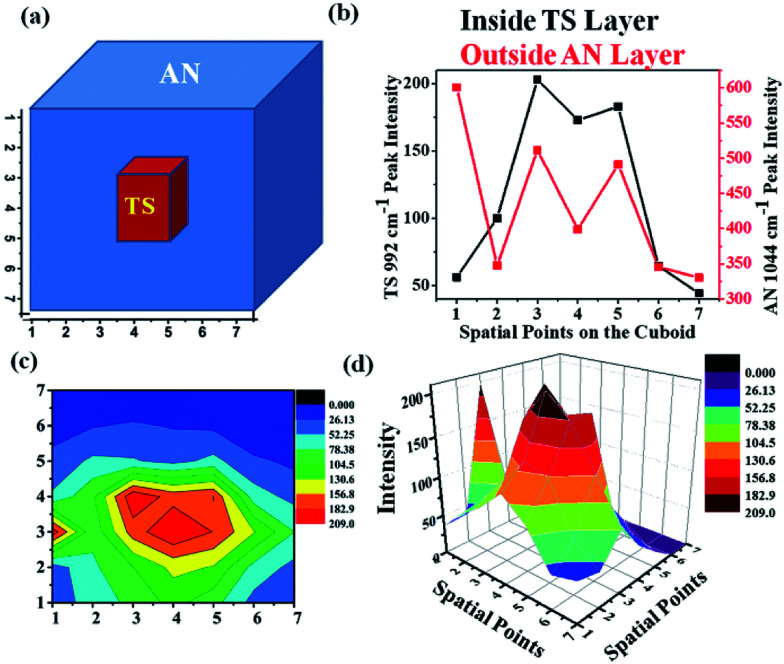
Fig. 11. Depth sensitive detection of bilayer solid powders ammonium nitrate (outer layer) and t-stilbene (inner layer) using UMARS where, (a) depicts the bilayer cuboid sample schematically, (b) is the Raman intensity variation of AN & TS as the signals were collected by keeping the y-axis constant (y = 4) i.e., at the center of the cuboid and by varying the x at that y, i.e., from x = 1 to x = 7; (c) shows the contour of the bilayer mapped with respect to TS Raman intensity where red colours corresponds to maximum TS intensity, blue corresponds to a minimum value; and (d) shows the 3D surface plot of the variation of TS Raman intensity.

Fig. 11