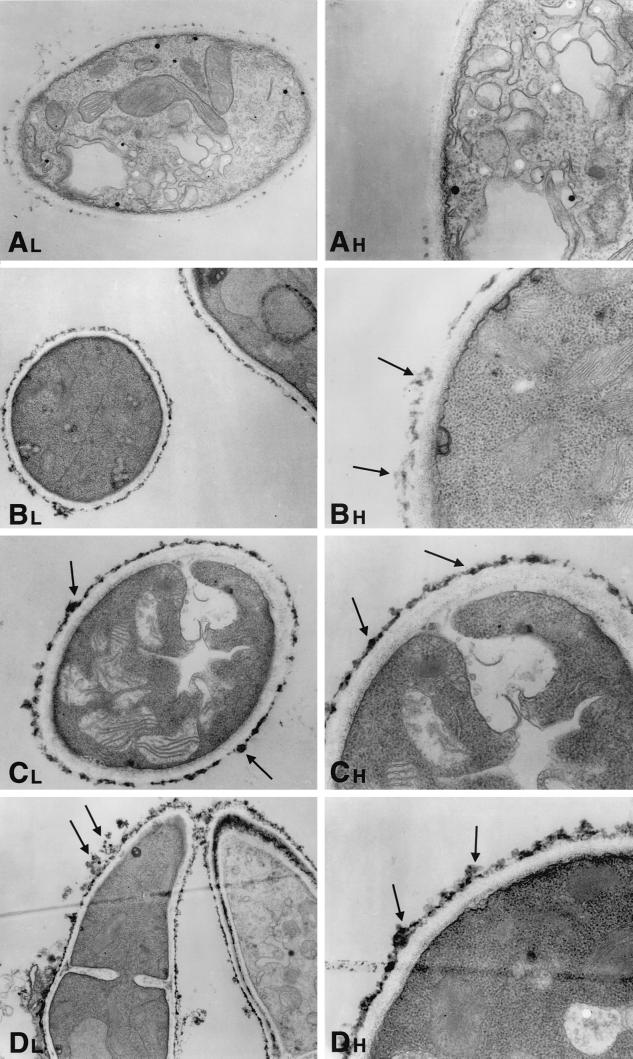
FIG. 5.
Time-sequenced electron microscopic changes of A. fumigatus (isolate 4215) after 4 h of incubation with NZ (32 μg/ml) and FK (0.5 μg/ml) alone and in combination. L, lower magnifications; H, higher magnifications. (A) Normal growth control of A. fumigatus hyphae.Magnifications, ×1,100 and ×3,100. (B) NZ alone. Scattered reticular aggregates appear on the outer surface of the fungal cell wall (arrows). Magnifications, ×620 and ×2,900. (C) FK alone. These photomicrographs demonstrate an increase in electron-dense aggregates on the outer fibrillar layer of the cell wall (arrows). Magnifications, ×620 and ×2,900. (D) NZ plus FK. The cell wall has increased reticular aggregations on the outer fibrillar layer (arrows). Magnifications, ×760 and ×2,900.

