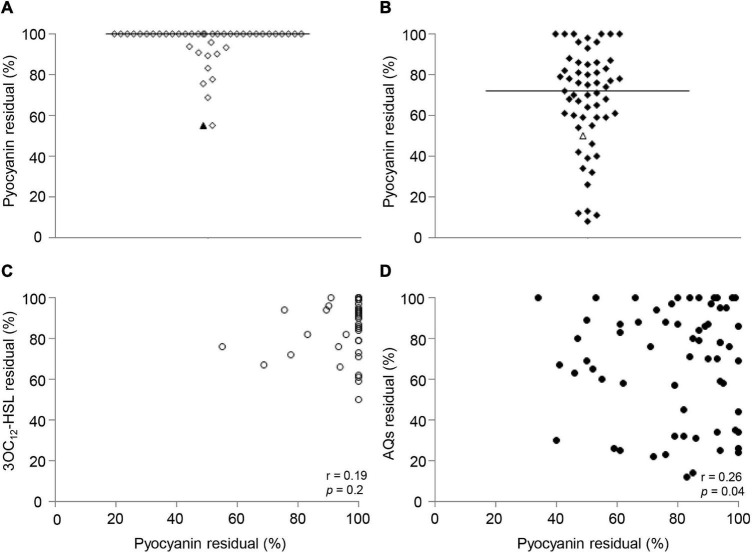
FIGURE 5.
Effect of niclosamide and clofoctol on pyocyanin production and correlation with QS signal levels. Residual levels of pyocyanin in CF isolates grown in presence of niclosamide (A) or clofoctol (B), reported as percentage with respect to the relative untreated samples. Each diamond represents an isolate. Triangles represent the laboratory strain PAO1. Black lines represent the median values. (C) XY correlation between pyocyanin residual levels and 3OC12-HSL residual levels (%) after niclosamide treatment. Each dot represents a CF isolate producing both pyocyanin and 3OC12-HSL (n = 42), Pearson correlation test: r = 0.19; p = 0.2. (D) XY correlation between pyocyanin residual levels and AQ residual levels (%) after clofoctol treatment. Pearson correlation test: r = 0.26; p < 0.05. Each dot represents a CF isolate producing both pyocyanin and AQs (n = 56). Each dot/diamond/triangle represents the average of three independent experiments for each CF isolate.

