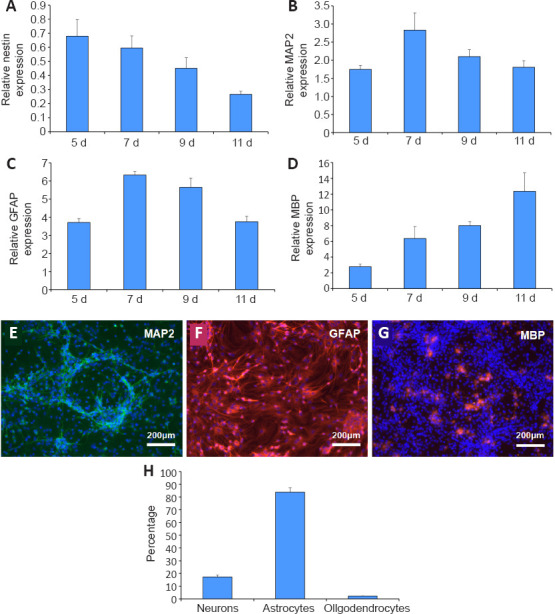
Figure 5.

Comparison of the neuroglial differentiation of neural stem cells with different induction times using a quantitative real-time polymerase chain reaction.
(A–D) Gene expression was detected by quantitative real time polymerase chain reaction. (A) The expression of nestin in the differentiated cells derived from neural stem cells at different induction times. (B) The expression of microtubule-associated protein 2 (MAP2) in the differentiated cells derived from neural stem cells at different induction times. (C) The expression of glial fibrillary acidic protein (GFAP) in the differentiated cells derived from neural stem cells at different induction times. (D) The expression of myelin basic protein (MBP) in the differentiated cells derived from neural stem cells at different induction times. The target gene expression was normalized to glyceraldehyde-3-phosphate dehydrogenase. (E) The differentiation of neural stem cells into neurons in the neurovascular unit model after 7 days of induction. MAP2-positive cells showed green fluorescence after fluorescein isothiocyanate staining and nuclei staining showed blue fluorescence under 4′,6-diamidino-2-phenylindole. (F) The differentiation of neural stem cells into astrocytes in the neurovascular unit model after 7 days of induction. GFAP-positive cells showed red fluorescence after tetraethyl rhodamine isothiocyanate staining and nuclei staining showed blue fluorescence under 4′,6-diamidino-2-phenylindole. (G) The differentiation of neural stem cells into oligodendrocytes in the neurovascular unit model after 7 days of induction. MBP-positive cells showed red fluorescence after tetraethyl rhodamine isothiocyanate staining and nuclei staining showed blue fluorescence under 4′,6-diamidino-2-phenylindole. Scale bars: 200 μm. (H) Neuro-glial sub-population percentages of neural stem derived cells showing the relative distribution of neurons to glia after 7 days of induction culture. Data are expressed as mean ± SD and were analyzed by a Student’s t-test. The experiments were repeated three times.
