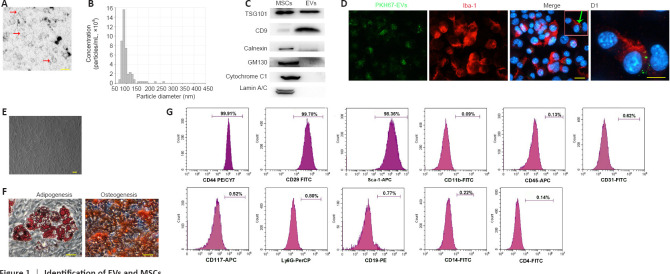
Figure 1.
Identification of EVs and MSCs.
(A) Transmission electron microscopy image of EVs (red arrows). Scale bar: 200 nm. (B) Nanoparticle tracking analysis of MSCs-EVs using the qNano platform. (C) Western blot analysis of TSG101, CD9, GM130, Lamin A/C, Cytochrome C1, and Calnexin in the MSCs and EVs. (D) Immunofluorescence analysis showing the internalization of PKH67-EVs by the BV-2 cells (green arrow) that had undergone 3-hour OGD. Scale bar: 20 µm. (D1) Magnification of the boxed region in D showing the location of the PKH67 hotspots. Scale bar: 5 μm. (E) Fluorescence microscopy image of the MSCs showing a typical spindle-like morphology. Scale bar: 20 μm. (F) Images showing the MSCs’ capacity to differentiate into adipocytes and osteoblasts. Scale bars: 100 μm. (G) Flow cytometry analysis of MSCs surface markers (positive markers: CD44, CD29, and Sca-1; negative markers: CD11b, CD45, CD31, CD117, Ly6G, CD19, CD14, and CD4). EV: Extracellular vesicle; MSC: mesenchymal stromal cell; TSG101: tumour susceptibility gene 101.

