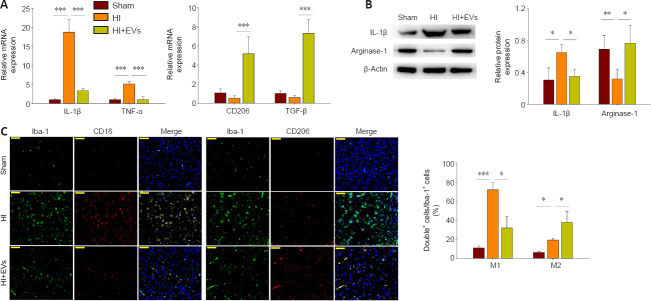
Figure 7.
MSCs-EVs promote M2 microglial polarization and suppress HI-induced neuroinflammation in the cortex ipsilateral to the HI.
(A) Quantitative reverse transcription polymerase chain reaction analysis of the mRNA levels of IL-1β, TNFα, TGF-β, and CD206 in the presence or absence of MSCs-EVs, 72 hours post-HI. (B) Western blot analysis of the levels of IL-1β and Arginase-1 in the presence or absence of MSCs-EVs, 72 hours post-HI. Results are shown for the cortex ipsilateral to the HI. (C) Representative photographs showing immunofluorescence staining of Iba-1 (green), CD16 (red), and CD206 (red) in the cortex ipsilateral to the HI, 72 hours post-HI. Scale bars: 50 μm. Graphs show the mean ± SD; *P < 0.05, **P < 0.01, ***P < 0.001 (one-way analysis of variance with Bonferroni correction). All of the experiments were carried out on six (A) or four (B, C) independent samples. Double+ cells mean Iba-1+CD16+ cells or Iba-1+CD206+ cells. EV: Extracellular vesicle; HI: hypoxia-ischemia; IL: interleukin; MSC: mesenchymal stromal cell; TGF-β: transforming growth factor-β; TNF-α: tumor necrosis factor α.

