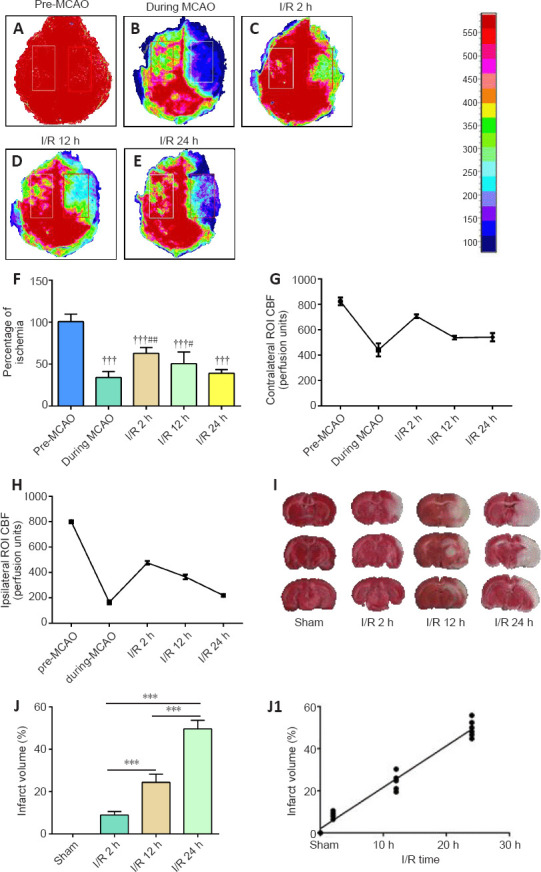
Figure 1.

The level of perfusion deficits increases with time after ischemia/reperfusion.
(A–E) Representative CBF pseudocolor images in the ischemic cortex before and during the MCAO, and 2, 12, and 24 hours after ischemia/reperfusion. The color bar represents the CBF capacity (in perfusion units). As the reperfusion time increased, the CBF decreased. (F) Quantification of the relative CBF in the region of interest (ROI; % of the baseline of each animal group). (G, H) CBFs in contralateral and ipsilateral ROI before and during MCAO, and 2, 12, and 24 hours after ischemia/reperfusion. (I) Representative images of 2,3,5-triphenyltetrazolium chloride (TTC)-stained brain slices. The volume of cerebral infarction (white) increased with the prolongation of reperfusion time. (J) Quantitative analysis of cerebral infarct volume. Data are reported as mean ± SEM (n = 6 per group). †††P < 0.001, vs. pre-MCAO; #P < 0.05, ##P < 0.01, vs. during MCAO; ***P < 0.001 (one-way analysis of variance followed by least significant difference test). CBF: Cerebral blood flow; MCAO: middle cerebral artery occlusion; ROI: region of interest.
