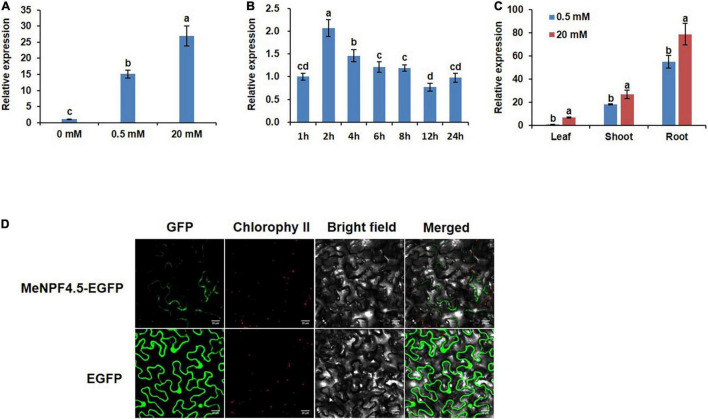
FIGURE 2.
Tissue-specific expression pattern and subcellular localization of the MeNPF4.5. (A) Relative expression of MeNPF4.5 in the roots of plants grown under different N conditions for 25 days. (B) Expression levels of MeNPF4.5 in N-starved roots at different times after N induction. Wild-type (WT) seedlings were grown in 10 mM NO3– for 20 days and under N starvation for 2 days, then were transferred to 20 mM NO3–. (C) Expression of MeNPF4.5 in various tissues of cassava. Cassava seedlings were cultivated under different N conditions (0.5 and 20 mM NO3–) in tissue culture for 25 days. Values are the means of three biological replicates ± SE. Lowercase letters above the bars (a–d) represent significant differences between treatments as determined by Student’s t-test (P < 0.05). (D) Subcellular localization of the MeNPF4.5-EGFP fusion protein in tobacco leaf epidermal cells. From left to right, GFP fluorescence, chlorophyll fluorescence, bright field, and merged images are shown. Bars = 20 μm.

