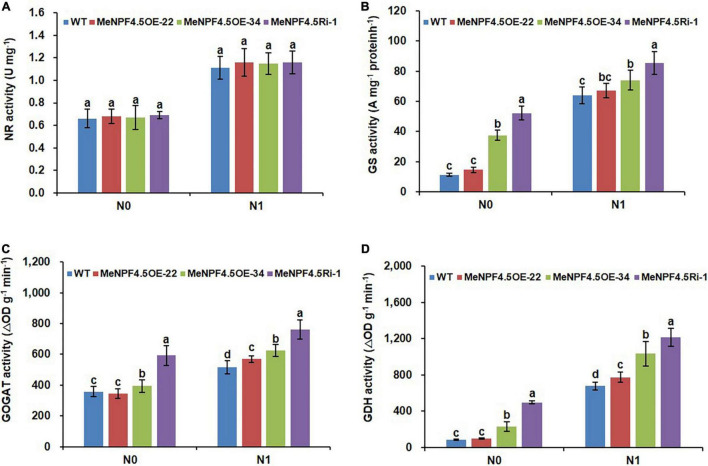
FIGURE 5.
Activity of N metabolism enzymes. Activities of NR (A), GS (B), GOGAT (C), and GDH (D) in the leaves of WT and MeNPF4.5 transgenic cassava harvested from the field. Values are the means of three biological replicates ± SE. Lowercase letters above the bars (a–d) represent significant differences between treatments as determined by Student’s t-test (P < 0.05). N0, low-N treatment, 0 kg ha–1; N1, normal N treatment, 125 kg ha–1.

