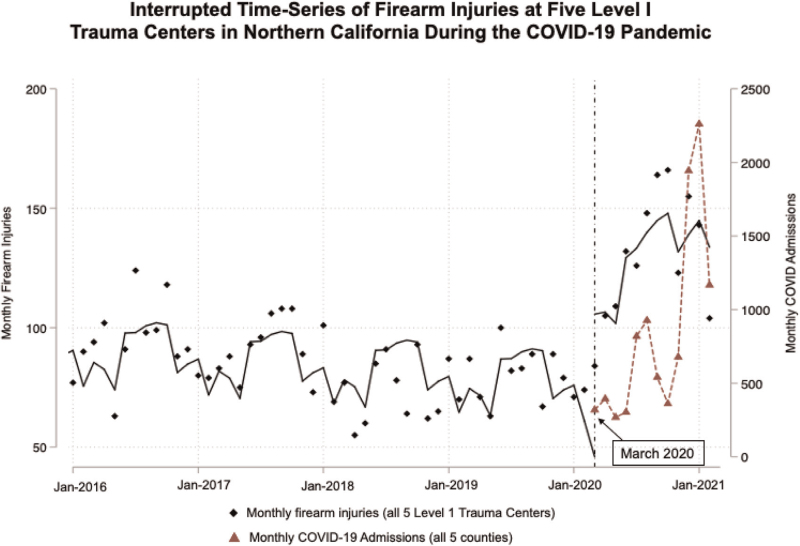
FIGURE 1.
Interrupted time-series analysis of firearm injuries at five level I trauma centers in Northern California during the COVID- 19 Pandemic. Black diamonds are values for number of monthly firearm injuries across all 5 sites, solid black line represents the modeled trend for monthly firearm injuries based on the interrupted time series model. Red triangles (connected by dotted red line) = monthly cumulative COVID-19 hospital admissions across all 5 Northern California counties in which trauma centers are located. Pre-pandemic, there were 86 (±16) firearm injuries/mo with a slight downtrend over time (by 0.5/mo, P < 0.01) and expected seasonal fluctuation. This was followed by a significant level-shift up in firearm injuries in March 2020 associated with the regional onset of the COVID-19 pandemic (by 39.4/mo, P < 0.01), followed by continued significant uptrend of 3.5 more firearm injuries/ mo (P < 0.01), with an overall average of 130 (±26) firearm injuries/mo during the pandemic.

