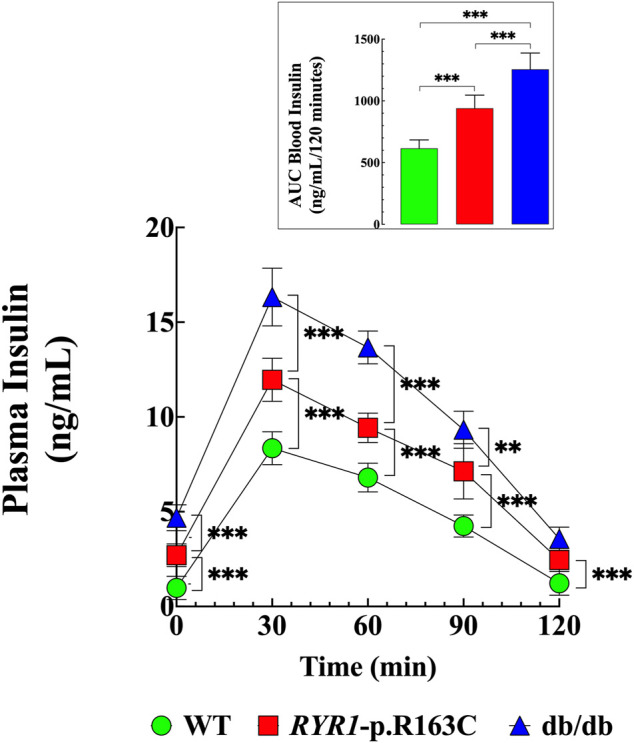
FIGURE 3.

Abnormal insulin levels in response to glucose challenge. Insulin levels were determined in WT, RYR1-p.R163C, and db/db mice after a glucose load. The basal level of insulin was higher in RyR1-p.R163C and db/db than in WT mice and during the test duration of 120 min. The insert shows the AUC calculated using the trapezoid rule of the insulin determination (GraphPad Prism software 9.0). Values are expressed as mean ± S.D. Experiments were conducted in n mice = 6 per genotype. Statistical analysis was performed as described above. ** = p < 0.01, *** = p < 0.001.
