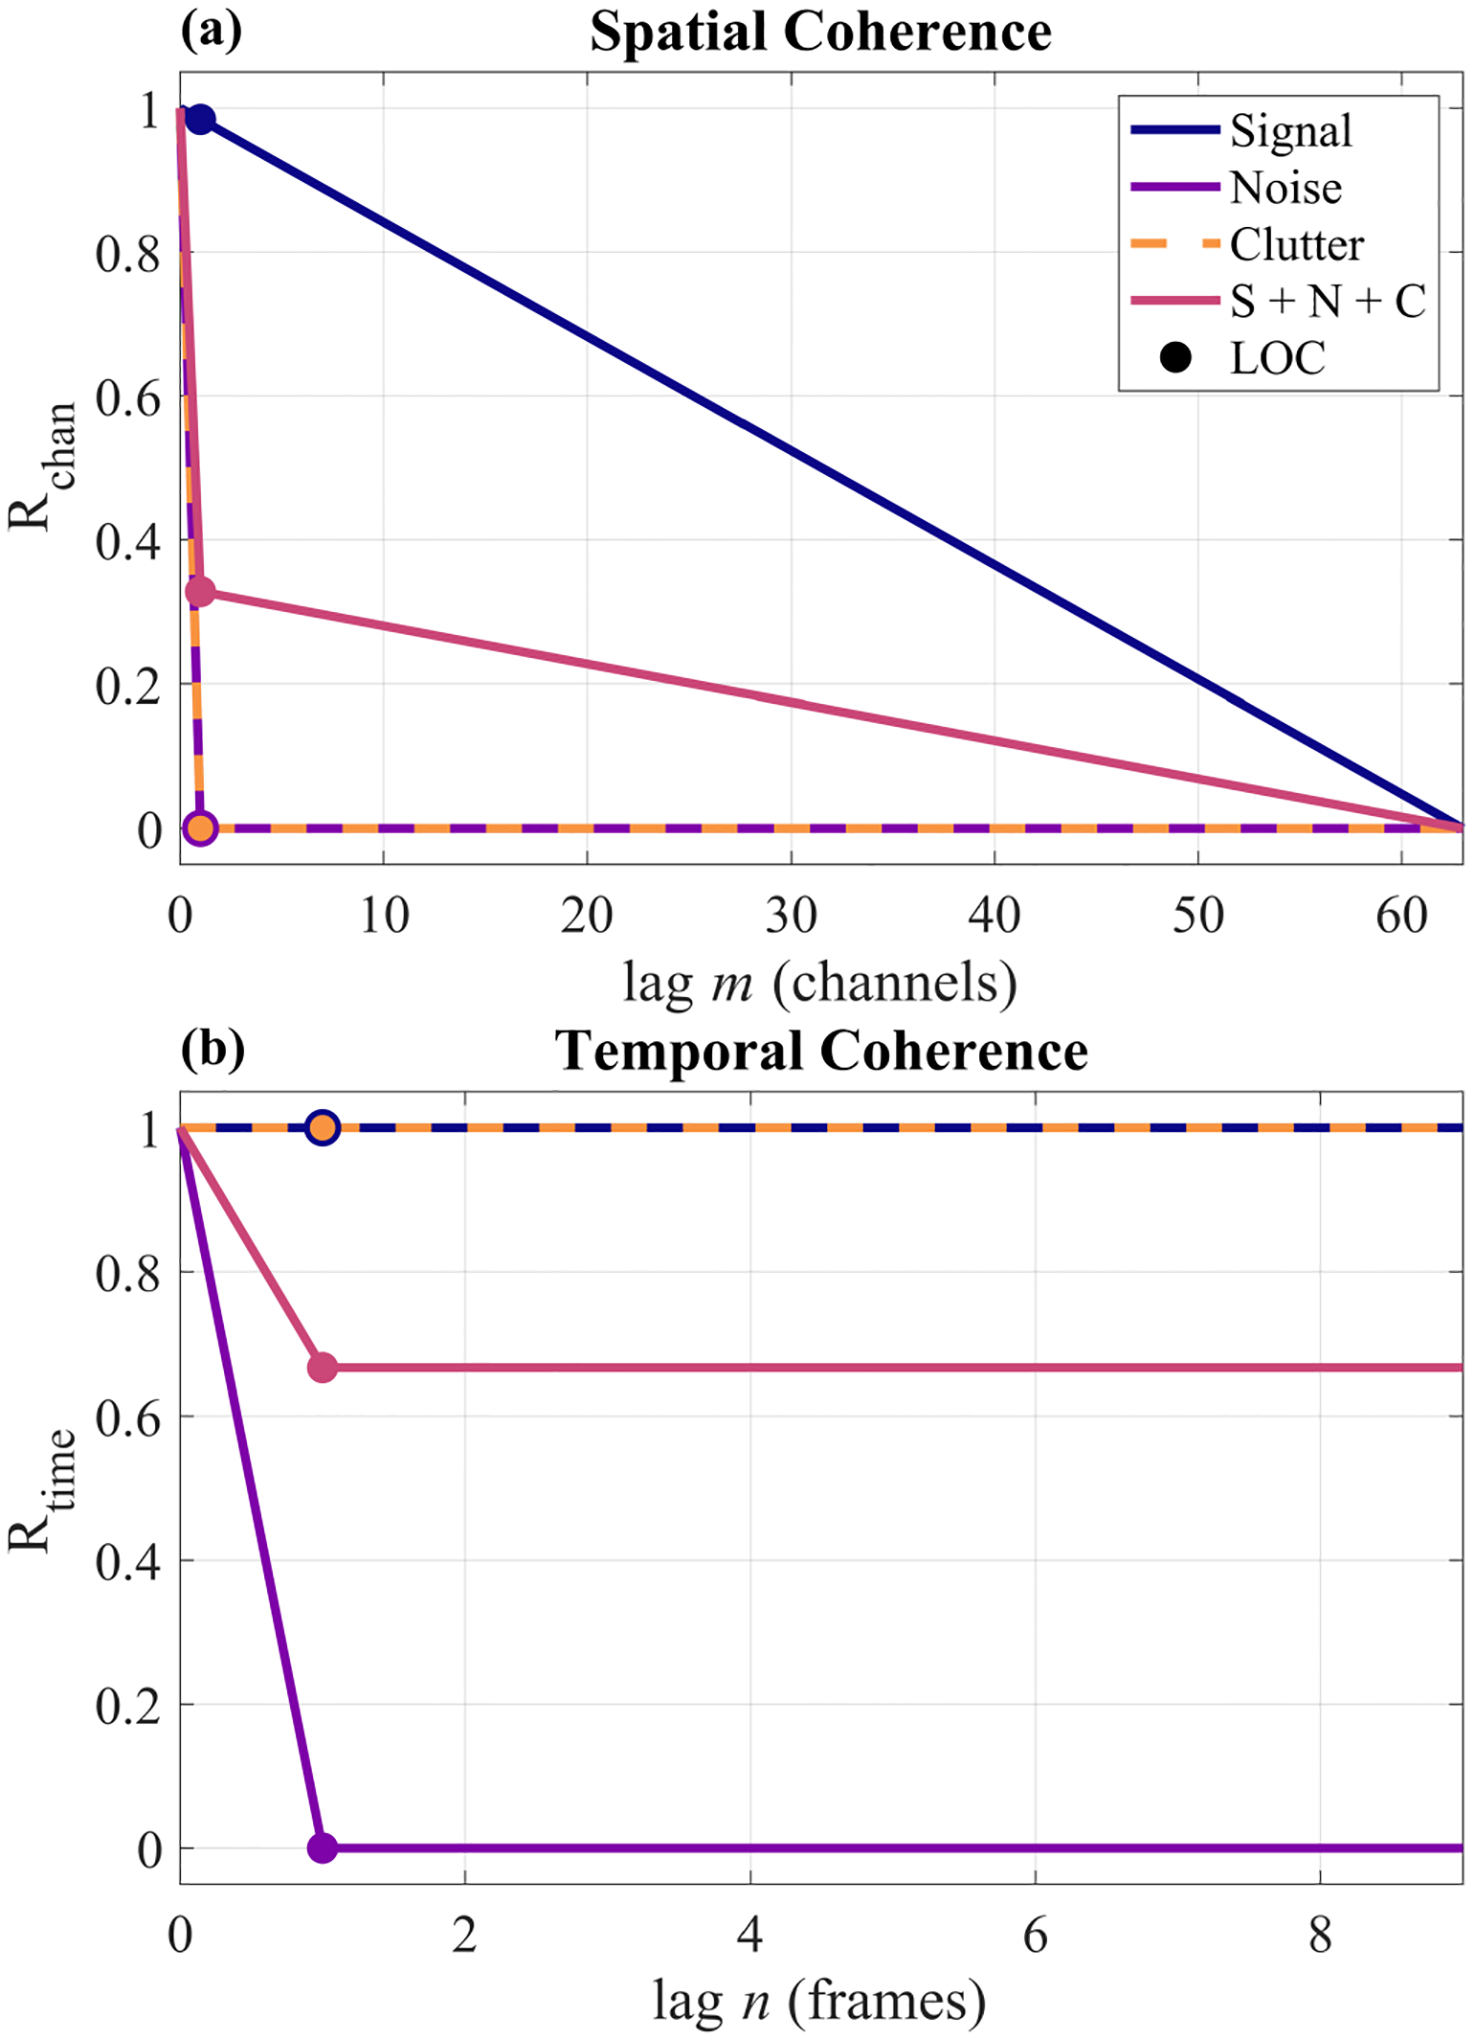
Fig. 1.

Theoretical spatial (a) and temporal (b) coherence curves for each signal component and their coherent summation (S + N + C). The noise and clutter components were each coherently added to the signal component at a 0 dB magnitude, i.e., an SNR of 0 dB and an SCR 0 dB. LOC corresponds to the lag-one coherence points that are estimated by Eqs. (5) and (9).
