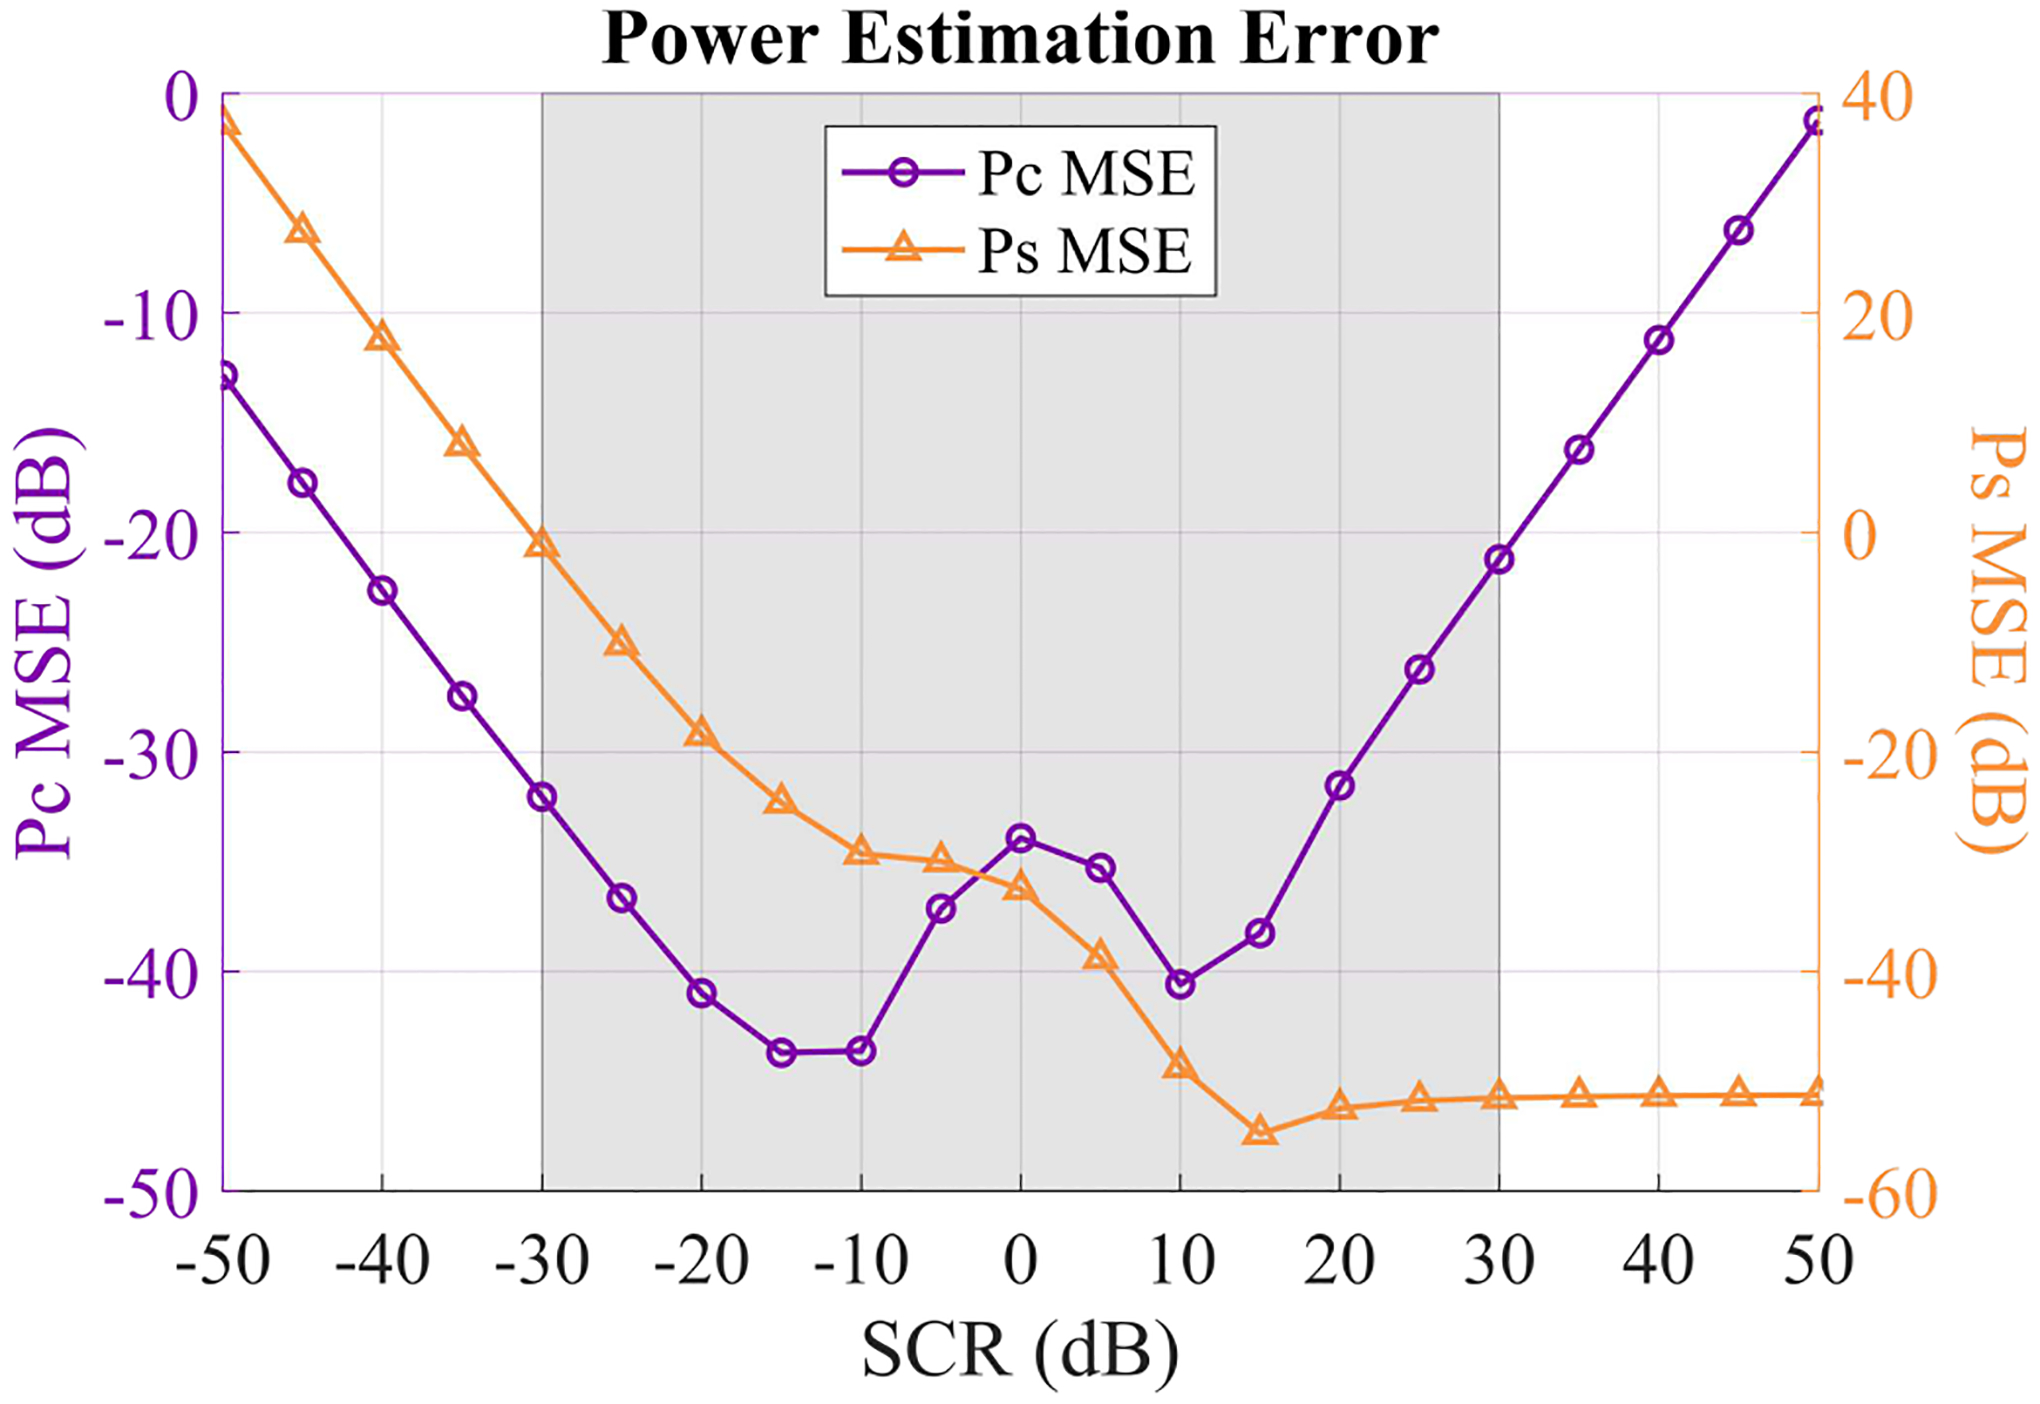
Fig. 10.

Mean squared error (MSE) for and across 10 independent signal + clutter + noise phantoms with varying SCR. SNR was set to 30 dB. and MSE were calculated on a linear scale, normalized by or , respectively, and then converted to units of dB for plotting. The gray shaded region indicates the range of SCR values that are relevant for in vivo imaging.
