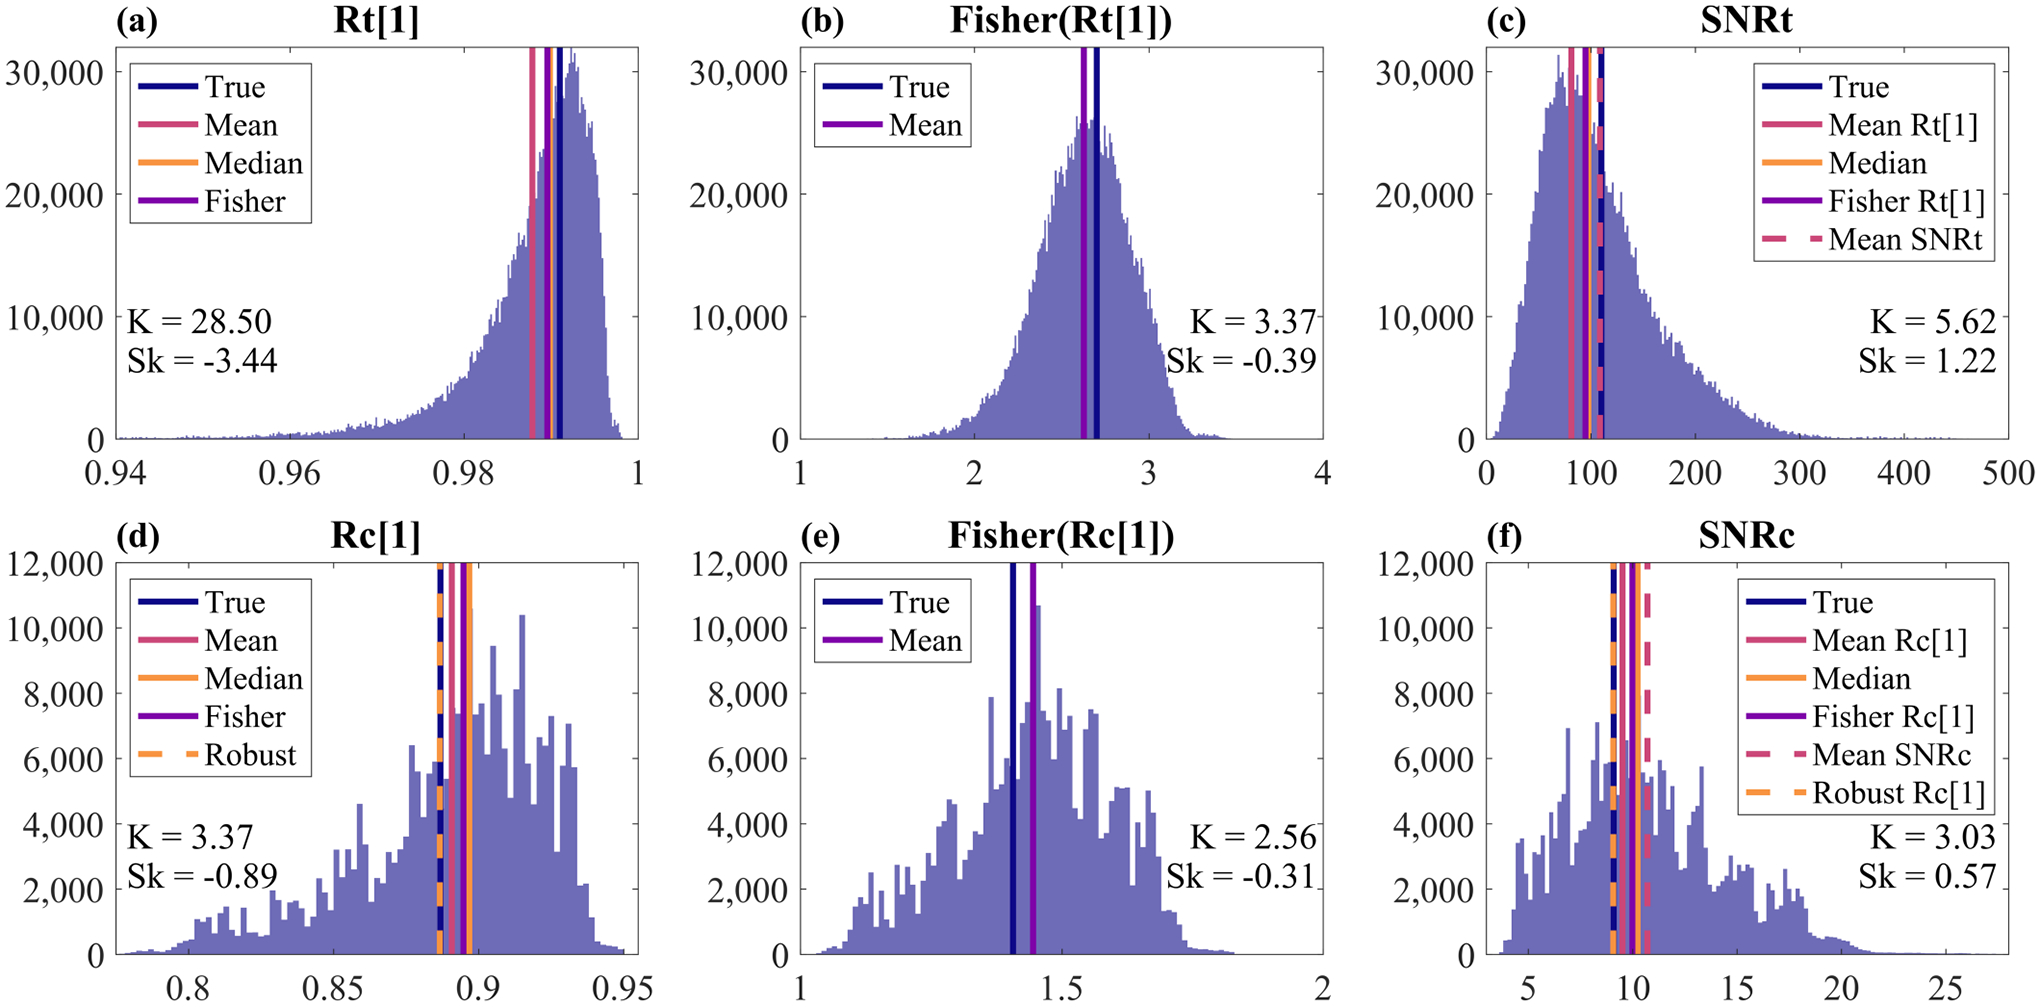
Fig. 5.

Histograms for (a) temporal LOC, (b) the Fisher z-transform of temporal LOC, (c) temporal SNR, (d), spatial LOC, (e) the Fisher z-transform of spatial LOC, and (f) channel SNR. Distributions were derived from a 2 mm ROI about the transmit focus of one simulated signal + clutter + noise phantom with 20 dB SNR and 10 dB SCR. Kurtosis (K) and skewness (Sk) are indicated in each panel. Note that the shapes of these distributions and subsequently the skewness and kurtosis will change for different SNR and SCR levels. Colored lines show the true values as well as distribution centrality as determined by various approaches (see Section IV-B). Note that the temporal and spatial coherence estimators used here were the ensemble estimators, i.e. Eqs. (6) and (10).
